BB&T 2012 Annual Report Download - page 91
Download and view the complete annual report
Please find page 91 of the 2012 BB&T annual report below. You can navigate through the pages in the report by either clicking on the pages listed below, or by using the keyword search tool below to find specific information within the annual report.-
 1
1 -
2
-
3
-
4
-
5
-
6
-
7
-
8
-
9
-
10
-
11
-
12
-
13
-
14
-
15
-
16
-
17
-
18
-
19
-
20
-
21
-
22
-
23
-
24
-
25
-
26
-
27
-
28
-
29
-
30
-
31
-
32
-
33
-
34
-
35
-
36
-
37
-
38
-
39
-
40
-
41
-
42
-
43
-
44
-
45
-
46
-
47
-
48
-
49
-
50
-
51
-
52
-
53
-
54
-
55
-
56
-
57
-
58
-
59
-
60
-
61
-
62
-
63
-
64
-
65
-
66
-
67
-
68
-
69
-
70
-
71
-
72
-
73
-
74
-
75
-
76
-
77
-
78
-
79
-
80
-
 81
81 -
 82
82 -
 83
83 -
 84
84 -
 85
85 -
 86
86 -
 87
87 -
 88
88 -
 89
89 -
 90
90 -
 91
91 -
 92
92 -
 93
93 -
 94
94 -
 95
95 -
 96
96 -
 97
97 -
 98
98 -
 99
99 -
 100
100 -
 101
101 -
102
-
103
-
104
-
105
-
106
-
107
-
108
-
109
-
110
-
111
-
112
-
113
-
114
-
115
-
116
-
117
-
118
-
119
-
120
-
121
-
122
-
123
-
124
-
125
-
126
-
127
-
128
-
129
-
130
-
131
-
132
-
133
-
134
-
135
-
136
-
137
-
138
-
139
-
140
-
141
-
142
-
143
-
144
-
145
-
146
-
147
-
148
-
149
-
150
-
151
-
152
-
153
-
154
-
155
-
156
-
157
-
158
-
159
-
160
-
161
-
162
-
163
-
164
-
165
-
166
-
167
-
168
-
169
-
170
-
171
-
172
-
173
-
174
-
175
-
176
 |
 |

69
the effects of higher costs for goods and services. Through its balance sheet management function, which is monitored by the
MRLCC, management believes that BB&T is positioned to respond to changing needs for liquidity, changes in interest rates
and inflationary trends.
Management uses the Simulation to measure the sensitivity of projected earnings to changes in interest rates. The Simulation
model projects net interest income and interest rate risk for a rolling two-year period of time. The Simulation takes into
account the current contractual agreements that BB&T has made with its customers on deposits, borrowings, loans,
investments and commitments to enter into those transactions. Furthermore, the Simulation considers the impact of expected
customer behavior. Management monitors BB&T’ s interest sensitivity by means of a model that incorporates current
volumes, average rates earned and paid, and scheduled maturities and payments of asset and liability portfolios, together with
multiple scenarios that include projected prepayments, repricing opportunities and anticipated volume growth. Using this
information, the model projects earnings based on projected portfolio balances under multiple interest rate scenarios. This
level of detail is needed to simulate the effect that changes in interest rates and portfolio balances may have on the earnings
of BB&T. This method is subject to the accuracy of the assumptions that underlie the process, but management believes that
it provides a better illustration of the sensitivity of earnings to changes in interest rates than other analyses such as static or
dynamic gap. In addition to Simulation analysis, BB&T uses EVE analysis to focus on projected changes in capital given
potential changes in interest rates. This measure also allows BB&T to analyze interest rate risk that falls outside the analysis
window contained in the Simulation model. The EVE model is a discounted cash flow of the entire portfolio of BB&T’ s
assets, liabilities, and derivatives instruments. The difference in the present value of assets minus the present value of
liabilities is defined as the economic value of BB&T’ s equity.
The asset/liability management process requires a number of key assumptions. Management determines the most likely
outlook for the economy and interest rates by analyzing external factors, including published economic projections and data,
the effects of likely monetary and fiscal policies, as well as any enacted or prospective regulatory changes. BB&T’ s current
and prospective liquidity position, current balance sheet volumes and projected growth, accessibility of funds for short-term
needs and capital maintenance are also considered. This data is combined with various interest rate scenarios to provide
management with the information necessary to analyze interest sensitivity and to aid in the development of strategies to reach
performance goals.
The following table shows the effect that the indicated changes in interest rates would have on net interest income as
projected for the next twelve months assuming a gradual change in interest rates as described below. Key assumptions in the
preparation of the table include prepayment speeds of mortgage-related assets, cash flows and maturities of derivative
financial instruments, loan volumes and pricing, deposit sensitivity, customer preferences and capital plans. The resulting
change in net interest income reflects the level of sensitivity that interest-sensitive income has in relation to changing interest
rates.
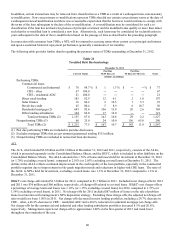
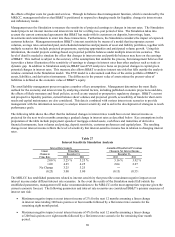
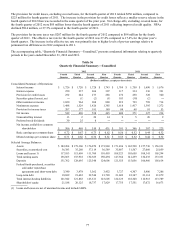
Table 27
Interest Sensitivity Simulation Analysis
Interest Rate Scenario Annualized Hypothetical Percentage
Linear Prime Rate Change in Net Interest Income
Change in December 31, December 31,
Prime Rate 2012 2011 2012 2011
2.00 % 5.25 % 5.25 % 3.16 % 3.92 %
1.00 4.25 4.25 2.04 2.27
No Change 3.25 3.25 ― ―
(0.25) 3.00 3.00 (0.13) (0.55)
The MRLCC has established parameters related to interest sensitivity that prescribe a maximum negative impact on net
interest income under different interest rate scenarios. In the event the results of the Simulation model fall outside the
established parameters, management will make recommendations to the MRLCC on the most appropriate response given the
current economic forecast. The following parameters and interest rate scenarios are considered BB&T’ s primary measures of
interest rate risk:
Maximum negative impact on net interest income of 2% for the next 12 months assuming a linear change
in interest rates totaling 100 basis points over four months followed by a flat interest rate scenario for the
remaining eight month period.
Maximum negative impact on net interest income of 4% for the next 12 months assuming a linear change
of 200 basis points over eight months followed by a flat interest rate scenario for the remaining four month
period.