BB&T 2012 Annual Report Download - page 140
Download and view the complete annual report
Please find page 140 of the 2012 BB&T annual report below. You can navigate through the pages in the report by either clicking on the pages listed below, or by using the keyword search tool below to find specific information within the annual report.-
 1
1 -
2
-
3
-
4
-
5
-
6
-
7
-
8
-
9
-
10
-
11
-
12
-
13
-
14
-
15
-
16
-
17
-
18
-
19
-
20
-
21
-
22
-
23
-
24
-
25
-
26
-
27
-
28
-
29
-
30
-
31
-
32
-
33
-
34
-
35
-
36
-
37
-
38
-
39
-
40
-
41
-
42
-
43
-
44
-
45
-
46
-
47
-
48
-
49
-
50
-
51
-
52
-
53
-
54
-
55
-
56
-
57
-
58
-
59
-
60
-
61
-
62
-
63
-
64
-
65
-
66
-
67
-
68
-
69
-
70
-
71
-
72
-
73
-
74
-
75
-
76
-
77
-
78
-
79
-
80
-
81
-
82
-
83
-
84
-
85
-
86
-
87
-
88
-
89
-
90
-
91
-
92
-
93
-
94
-
95
-
96
-
97
-
98
-
99
-
100
-
101
-
102
-
103
-
104
-
105
-
106
-
107
-
108
-
109
-
110
-
111
-
112
-
113
-
114
-
115
-
116
-
117
-
118
-
119
-
120
-
121
-
122
-
123
-
124
-
125
-
126
-
127
-
128
-
129
-
 130
130 -
 131
131 -
 132
132 -
 133
133 -
 134
134 -
 135
135 -
 136
136 -
 137
137 -
 138
138 -
 139
139 -
 140
140 -
 141
141 -
 142
142 -
 143
143 -
 144
144 -
 145
145 -
 146
146 -
 147
147 -
 148
148 -
 149
149 -
 150
150 -
151
-
152
-
153
-
154
-
155
-
156
-
157
-
158
-
159
-
160
-
161
-
162
-
163
-
164
-
165
-
166
-
167
-
168
-
169
-
170
-
171
-
172
-
173
-
174
-
175
-
176
 |
 |

118
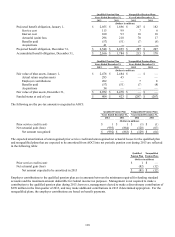
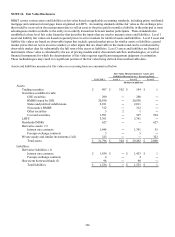
Qualified Pension Plan Nonqualified Pension Plans
Years Ended December 31, Years Ended December 31,
2012 2011 2012 2011
(Dollars in millions)
Projected benefit obligation, January 1, $ 2,055 $ 1,696 $ 207 $ 182
Service cost 113 99 7 6
Interest cost 100 93 10 10
Actuarial (gain) loss 296 218 70 17
Benefits paid (57) (51) (7) (8)
Acquisitions 41 ― ― ―
Projected benefit obligation, December 31, $ 2,548 $ 2,055 $ 287 $ 207
Accumulated benefit obligation, December 31, $ 2,166 $ 1,784 $ 213 $ 178
Qualified Pension Plan Nonqualified Pension Plans
Years Ended December 31, Years Ended December 31,
2012 2011 2012 2011
(Dollars in millions)
Fair value of plan assets, January 1, $ 2,478 $ 2,484 $ — $ —
Actual return on plan assets 295 45 — —
Employer contributions 202 — 7 8
Benefits paid (57) (51) (7) (8)
Acquisitions 34 — — —
Fair value of plan assets, December 31, $ 2,952 $ 2,478 $ — $ —
Funded status at end of year $ 404 $ 423 $ (287) $ (207)
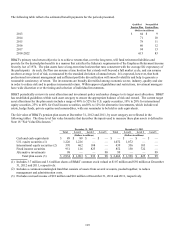
The following are the pre-tax amounts recognized in AOCI:
Qualified Pension Plan Nonqualified Pension Plans
Years Ended December 31, Years Ended December 31,
2012 2011 2012 2011
(Dollars in millions)
Prior service credit (cost) $ 1 $ 1 $ (1) $ (1)
N
et actuarial gain (loss) (993) (864) (128) (63)
N
et amount recognize
d
$ (992) $ (863) $ (129) $ (64)
The expected amortization of unrecognized prior service credit and unrecognized net actuarial losses for the qualified plan
and nonqualified plans that are expected to be amortized from AOCI into net periodic pension cost during 2013 are reflected
in the following table:
Qualified Nonqualified
Pension Plan Pension Plans
(Dollars in millions)
Prior service credit (cost) $ 1 $ —
N
et actuarial gain (loss) (82) (12)
N
et amount expected to be amortized in 2013 $ (81) $ (12)
Employer contributions to the qualified pension plan are in amounts between the minimum required for funding standard
accounts and the maximum amount deductible for federal income tax purposes. Management is not required to make a
contribution to the qualified pension plan during 2013; however, management elected to make a discretionary contribution of
$270 million in the first quarter of 2013, and may make additional contributions in 2013 if determined appropriate. For the
nonqualified plans, the employer contributions are based on benefit payments.