BB&T 2012 Annual Report Download - page 137
Download and view the complete annual report
Please find page 137 of the 2012 BB&T annual report below. You can navigate through the pages in the report by either clicking on the pages listed below, or by using the keyword search tool below to find specific information within the annual report.-
 1
1 -
2
-
3
-
4
-
5
-
6
-
7
-
8
-
9
-
10
-
11
-
12
-
13
-
14
-
15
-
16
-
17
-
18
-
19
-
20
-
21
-
22
-
23
-
24
-
25
-
26
-
27
-
28
-
29
-
30
-
31
-
32
-
33
-
34
-
35
-
36
-
37
-
38
-
39
-
40
-
41
-
42
-
43
-
44
-
45
-
46
-
47
-
48
-
49
-
50
-
51
-
52
-
53
-
54
-
55
-
56
-
57
-
58
-
59
-
60
-
61
-
62
-
63
-
64
-
65
-
66
-
67
-
68
-
69
-
70
-
71
-
72
-
73
-
74
-
75
-
76
-
77
-
78
-
79
-
80
-
81
-
82
-
83
-
84
-
85
-
86
-
87
-
88
-
89
-
90
-
91
-
92
-
93
-
94
-
95
-
96
-
97
-
98
-
99
-
100
-
101
-
102
-
103
-
104
-
105
-
106
-
107
-
108
-
109
-
110
-
111
-
112
-
113
-
114
-
115
-
116
-
117
-
118
-
119
-
120
-
121
-
122
-
123
-
124
-
125
-
126
-
 127
127 -
 128
128 -
 129
129 -
 130
130 -
 131
131 -
 132
132 -
 133
133 -
 134
134 -
 135
135 -
 136
136 -
 137
137 -
 138
138 -
 139
139 -
 140
140 -
 141
141 -
 142
142 -
 143
143 -
 144
144 -
 145
145 -
 146
146 -
 147
147 -
148
-
149
-
150
-
151
-
152
-
153
-
154
-
155
-
156
-
157
-
158
-
159
-
160
-
161
-
162
-
163
-
164
-
165
-
166
-
167
-
168
-
169
-
170
-
171
-
172
-
173
-
174
-
175
-
176
 |
 |

115
Years Ended December 31,
2012 2011 2010
(Dollars in millions)
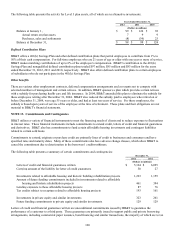
Federal income taxes at statutory rate of 35% $ 977 $ 570 $ 339
Increase (decrease) in provision for income taxes as a result of:
State income taxes, net of Federal tax benefit 61 31 11
Federal tax credits (126) (115) (105)
Tax exempt income (133) (135) (125)
N
ontaxable gain on termination of leveraged lease (12) (22) (2)
Other, net (3) (33) (3)
Provision for income taxes $ 764 $ 296 $ 115
Effective income tax rate 27.4 % 18.2 % 11.9 %
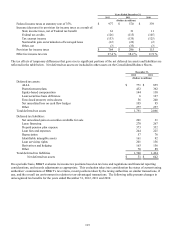
The tax effects of temporary differences that gave rise to significant portions of the net deferred tax assets and liabilities are
reflected in the table below. Net deferred tax assets are included in other assets on the Consolidated Balance Sheets.
December 31,
2012 2011
(Dollars in millions)
Deferred tax assets:
ALLL $ 771 $ 855
Postretirement plans 432 362
Equity-based compensation 144 130
Loan/securities basis difference 6 127
Foreclosed property write-downs 56 240
N
et unrealized loss on cash flow hedges 105 95
Other 277 257
Total deferred tax assets 1,791 2,066
Deferred tax liabilities:
N
et unrealized gain on securities available for sale 201 31
Lease financing 270 267
Prepaid pension plan expense 373 352
Loan fees and expenses 244 225
Depreciation 57 76
Identifiable intangible assets 161 92
Loan servicing rights 201 156
Derivatives and hedging 163 136
Other 70 89
Total deferred tax liabilities 1,740 1,424
N
et deferred tax assets $ 51 $ 642
On a periodic basis, BB&T evaluates its income tax positions based on tax laws and regulations and financial reporting
considerations, and records adjustments as appropriate. This evaluation takes into consideration the status of current taxing
authorities’ examinations of BB&T’ s tax returns, recent positions taken by the taxing authorities on similar transactions, if
any, and the overall tax environment in relation to tax-advantaged transactions. The following table presents changes in
unrecognized tax benefits for the years ended December 31, 2012, 2011 and 2010.