BB&T 2012 Annual Report Download - page 48
Download and view the complete annual report
Please find page 48 of the 2012 BB&T annual report below. You can navigate through the pages in the report by either clicking on the pages listed below, or by using the keyword search tool below to find specific information within the annual report.-
 1
1 -
2
-
3
-
4
-
5
-
6
-
7
-
8
-
9
-
10
-
11
-
12
-
13
-
14
-
15
-
16
-
17
-
18
-
19
-
20
-
21
-
22
-
23
-
24
-
25
-
26
-
27
-
28
-
29
-
30
-
31
-
32
-
33
-
34
-
35
-
36
-
37
-
 38
38 -
 39
39 -
 40
40 -
 41
41 -
 42
42 -
 43
43 -
 44
44 -
 45
45 -
 46
46 -
 47
47 -
 48
48 -
 49
49 -
 50
50 -
 51
51 -
 52
52 -
 53
53 -
 54
54 -
 55
55 -
 56
56 -
 57
57 -
 58
58 -
59
-
60
-
61
-
62
-
63
-
64
-
65
-
66
-
67
-
68
-
69
-
70
-
71
-
72
-
73
-
74
-
75
-
76
-
77
-
78
-
79
-
80
-
81
-
82
-
83
-
84
-
85
-
86
-
87
-
88
-
89
-
90
-
91
-
92
-
93
-
94
-
95
-
96
-
97
-
98
-
99
-
100
-
101
-
102
-
103
-
104
-
105
-
106
-
107
-
108
-
109
-
110
-
111
-
112
-
113
-
114
-
115
-
116
-
117
-
118
-
119
-
120
-
121
-
122
-
123
-
124
-
125
-
126
-
127
-
128
-
129
-
130
-
131
-
132
-
133
-
134
-
135
-
136
-
137
-
138
-
139
-
140
-
141
-
142
-
143
-
144
-
145
-
146
-
147
-
148
-
149
-
150
-
151
-
152
-
153
-
154
-
155
-
156
-
157
-
158
-
159
-
160
-
161
-
162
-
163
-
164
-
165
-
166
-
167
-
168
-
169
-
170
-
171
-
172
-
173
-
174
-
175
-
176
 |
 |

26
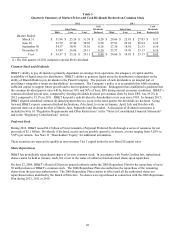
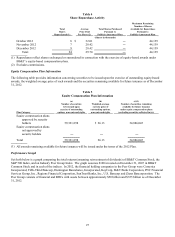
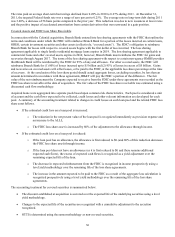
Table 3
Quarterly Summary of Market Prices and Cash Dividends Declared on Common Stock
2012 2011
Cash Cash
Sales Prices Dividends Sales Prices Dividends
High Low Last Declared High Low Last Declared (1)
Quarter Ended:
March 31 $ 31.94 $ 25.26 $ 31.39 $ 0.20 $ 29.60 $ 25.95 $ 27.45 $ 0.17
June 30 32.74 27.40 30.85 0.20 27.81 25.24 26.84 0.16
September 30 34.37 30.41 33.16 0.20 27.36 18.92 21.33 0.16
December 31 33.89 26.86 29.11 0.20 25.57 19.76 25.17 0.16
Year $ 34.37 $ 25.26 $ 29.11 $ 0.80 $ 29.60 $ 18.92 $ 25.17 $ 0.65
(1) The first quarter of 2011 included a special $0.01 dividend.
Common Stock and Dividends
BB&T’ s ability to pay dividends is primarily dependent on earnings from operations, the adequacy of capital and the
availability of liquid assets for distribution. BB&T’ s ability to generate liquid assets for distribution is dependent on the
ability of Branch Bank to pay dividends to the Parent Company. The payment of cash dividends is an integral part of
providing a competitive return on shareholders’ investments. The Company’ s policy is to accomplish this while retaining
sufficient capital to support future growth and to meet regulatory requirements. Management has established a guideline that
the common dividend payout ratio will be between 30% and 50% of basic EPS during normal economic conditions. BB&T’ s
common dividend payout ratio, computed by dividing dividends declared per common share by basic EPS, was 29.2% in
2012 compared to 35.1% in 2011. BB&T has paid a cash dividend to shareholders every year since 1903. In January 2013,
BB&T aligned scheduled common dividend payment dates to occur in the same quarter the dividends are declared. Going
forward, BB&T expects common dividend declarations, if declared, to occur in January, April, July and October with
payment dates on or about the first of March, June, September and December. A discussion of dividend restrictions is
included in Note 16 “Regulatory Requirements and Other Restrictions” in the “Notes to Consolidated Financial Statements”
and in the “Regulatory Considerations” section.
Preferred Stock
During 2012, BB&T issued $2.2 billion of Non-Cumulative Perpetual Preferred Stock through a series of issuances for net
proceeds of $2.1 billion. Dividends, if declared, accrue and are payable quarterly, in arrears, at rates ranging from 5.20% to
5.85% per annum. See Note 11 “Shareholders’ Equity” for additional information.
These securities are expected to qualify as non-common Tier 1 capital under the new Basel III capital rules.
Share Repurchases
BB&T has periodically repurchased shares of its own common stock. In accordance with North Carolina law, repurchased
shares cannot be held as treasury stock, but revert to the status of authorized and unissued shares upon repurchase.
On June 27, 2006, BB&T’ s Board of Directors granted authority under the 2006 Repurchase Plan for the repurchase of up to
50 million shares of BB&T’ s common stock. The 2006 Repurchase Plan also authorizes the repurchase of the remaining
shares from the previous authorization. The 2006 Repurchase Plan remains in effect until all the authorized shares are
repurchased unless modified by the Board of Directors. No shares were repurchased in connection with the 2006 Repurchase
Plan during 2012, 2011 or 2010.