BB&T 2012 Annual Report Download - page 122
Download and view the complete annual report
Please find page 122 of the 2012 BB&T annual report below. You can navigate through the pages in the report by either clicking on the pages listed below, or by using the keyword search tool below to find specific information within the annual report.-
 1
1 -
2
-
3
-
4
-
5
-
6
-
7
-
8
-
9
-
10
-
11
-
12
-
13
-
14
-
15
-
16
-
17
-
18
-
19
-
20
-
21
-
22
-
23
-
24
-
25
-
26
-
27
-
28
-
29
-
30
-
31
-
32
-
33
-
34
-
35
-
36
-
37
-
38
-
39
-
40
-
41
-
42
-
43
-
44
-
45
-
46
-
47
-
48
-
49
-
50
-
51
-
52
-
53
-
54
-
55
-
56
-
57
-
58
-
59
-
60
-
61
-
62
-
63
-
64
-
65
-
66
-
67
-
68
-
69
-
70
-
71
-
72
-
73
-
74
-
75
-
76
-
77
-
78
-
79
-
80
-
81
-
82
-
83
-
84
-
85
-
86
-
87
-
88
-
89
-
90
-
91
-
92
-
93
-
94
-
95
-
96
-
97
-
98
-
99
-
100
-
101
-
102
-
103
-
104
-
105
-
106
-
107
-
108
-
109
-
110
-
111
-
 112
112 -
 113
113 -
 114
114 -
 115
115 -
 116
116 -
 117
117 -
 118
118 -
 119
119 -
 120
120 -
 121
121 -
 122
122 -
 123
123 -
 124
124 -
 125
125 -
 126
126 -
 127
127 -
 128
128 -
 129
129 -
 130
130 -
 131
131 -
 132
132 -
133
-
134
-
135
-
136
-
137
-
138
-
139
-
140
-
141
-
142
-
143
-
144
-
145
-
146
-
147
-
148
-
149
-
150
-
151
-
152
-
153
-
154
-
155
-
156
-
157
-
158
-
159
-
160
-
161
-
162
-
163
-
164
-
165
-
166
-
167
-
168
-
169
-
170
-
171
-
172
-
173
-
174
-
175
-
176
 |
 |

100
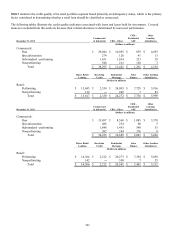
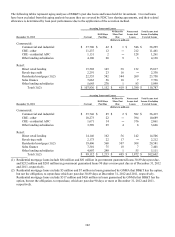
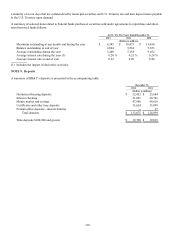
The following tables provide a breakdown of the ALLL and the recorded investment in loans based on the method for
determining the allowance:
ALLL
December 31, 2012 December 31, 2011
Individually Collectively Individually Collectively
Evaluated Evaluated Evaluated Evaluated
for for for for
Impairment Impairment Impairment Impairment
(Dollars in millions)
Commercial:
Commercial and industrial $ 73 $ 397 $ 77 $ 356
CRE - other 36 168 69 265
CRE - residential ADC 21 79 50 236
Other lending subsidiaries 1 12 1 10
Retail:
Direct retail lending 59 241 35 197
Revolving credit 24 78 27 85
Residential mortgage 130 198 152 213
Sales finance 6 23 1 37
Other lending subsidiaries 61 203 20 166
Covered ― 128 ― 149
Unallocated ― 80 ― 110
Total $ 411 $ 1,607 $ 432 $ 1,824
Loans and Leases
December 31, 2012 December 31, 2011
Individually Collectively Individually Collectively
Evaluated Evaluated Evaluated Evaluated
for for for for
Impairment Impairment Impairment Impairment
(Dollars in millions)
Commercial:
Commercial and industrial $ 631 $ 37,664 $ 656 $ 35,759
CRE - other 312 11,149 511 10,178
CRE - residential ADC 155 1,106 420 1,641
Other lending subsidiaries 3 4,135 5 3,621
Retail:
Direct retail lending 235 15,582 165 14,341
Revolving credit 56 2,274 62 2,150
Residential mortgage 1,187 23,085 931 19,650
Sales finance 22 7,714 10 7,391
Other lending subsidiaries 146 5,853 49 5,062
Covered ― 3,294 ― 4,867
Total $ 2,747 $ 111,856 $ 2,809 $ 104,660
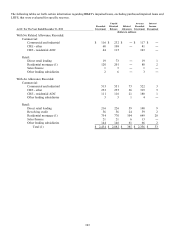
BB&T monitors the credit quality of its commercial portfolio segment using internal risk ratings. These risk ratings are
based on established regulatory guidance. Loans with a Pass rating represent those not considered a problem credit. Special
mention loans are those that have a potential weakness deserving management’ s close attention. Substandard loans are those
for which a well-defined weakness has been identified that may put full collection of contractual cash flows at risk.
Substandard loans are placed in nonaccrual status when BB&T believes it is no longer probable it will collect all contractual
cash flows. BB&T assigns an internal risk rating at loan origination and reviews the relationship again on an annual basis or
at any point management becomes aware of information affecting the borrower’ s ability to fulfill their obligations.