BB&T 2012 Annual Report Download - page 155
Download and view the complete annual report
Please find page 155 of the 2012 BB&T annual report below. You can navigate through the pages in the report by either clicking on the pages listed below, or by using the keyword search tool below to find specific information within the annual report.-
 1
1 -
2
-
3
-
4
-
5
-
6
-
7
-
8
-
9
-
10
-
11
-
12
-
13
-
14
-
15
-
16
-
17
-
18
-
19
-
20
-
21
-
22
-
23
-
24
-
25
-
26
-
27
-
28
-
29
-
30
-
31
-
32
-
33
-
34
-
35
-
36
-
37
-
38
-
39
-
40
-
41
-
42
-
43
-
44
-
45
-
46
-
47
-
48
-
49
-
50
-
51
-
52
-
53
-
54
-
55
-
56
-
57
-
58
-
59
-
60
-
61
-
62
-
63
-
64
-
65
-
66
-
67
-
68
-
69
-
70
-
71
-
72
-
73
-
74
-
75
-
76
-
77
-
78
-
79
-
80
-
81
-
82
-
83
-
84
-
85
-
86
-
87
-
88
-
89
-
90
-
91
-
92
-
93
-
94
-
95
-
96
-
97
-
98
-
99
-
100
-
101
-
102
-
103
-
104
-
105
-
106
-
107
-
108
-
109
-
110
-
111
-
112
-
113
-
114
-
115
-
116
-
117
-
118
-
119
-
120
-
121
-
122
-
123
-
124
-
125
-
126
-
127
-
128
-
129
-
130
-
131
-
132
-
133
-
134
-
135
-
136
-
137
-
138
-
139
-
140
-
141
-
142
-
143
-
144
-
 145
145 -
 146
146 -
 147
147 -
 148
148 -
 149
149 -
 150
150 -
 151
151 -
 152
152 -
 153
153 -
 154
154 -
 155
155 -
 156
156 -
 157
157 -
 158
158 -
 159
159 -
 160
160 -
 161
161 -
 162
162 -
 163
163 -
 164
164 -
 165
165 -
166
-
167
-
168
-
169
-
170
-
171
-
172
-
173
-
174
-
175
-
176
 |
 |

133
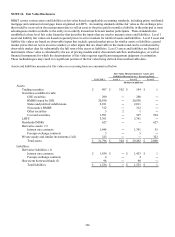
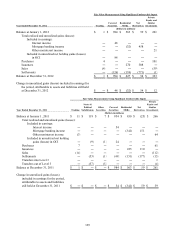
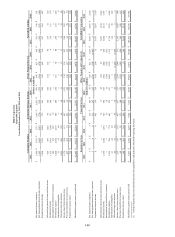
NOTE 19. Derivative Financial Instruments
The following tables set forth certain information concerning BB&T’ s derivative financial instruments and related hedged
items as of the periods indicated:
Derivative Classifications and Hedging Relationships
December 31, 2012 December 31, 2011
Hedged Item or Notional Fair Value Notional Fair Value
Transaction Amount Gain (1) Loss (1) Amount Gain (1) Loss (1)
(Dollars in millions)
Cash Flow Hedges: (2)
Interest rate contracts:
Pay fixed swaps 3 month LIBOR funding $ 6,035 $ ―$ (298) $ 5,750 $ ―$ (307)
Total 6,035 ― (298) 5,750 ― (307)
N
et Investment Hedges:
Foreign exchange contracts ― ― ― 73 1 ―
Total ― ― ― 73 1 ―
Fair Value Hedges:
Interest rate contracts:
Receive fixed swaps and option trades Long-term debt 800 182 ― 2,556 254 ―
Pay fixed swaps Commercial loans 187 ― (7) 98 ― (5)
Pay fixed swaps Municipal securities 345 ― (153) 355 ― (158)
Total 1,332 182 (160) 3,009 254 (163)
N
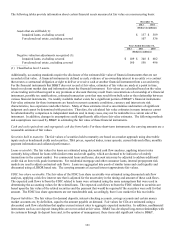
ot Designated as Hedges:
Client-related and other risk management:
Interest rate contracts:
Receive fixed swaps 9,352 687 ― 9,176 703 ―
Pay fixed swaps 9,464 ― (717) 9,255 ― (730)
Other swaps 2,273 1 (2) 2,450 ― (6)
Option trades 814 23 (26) 1,004 38 (40)
Futures contracts 109 ― ― 240 ― ―
Risk participations 204 ― ― 150 ― ―
Foreign exchange contracts 1,005 5 (4) 575 6 (8)
Total 23,221 716 (749) 22,850 747 (784)
Mortgage Banking:
Interest rate contracts:
Receive fixed swaps 114 ― (2) 50 1 ―
Pay fixed swaps ― ― ― 16 ― ―
Interest rate lock commitments 6,064 55 (1) 4,977 60 (1)
When issued securities, forward rate agreements and forward
commitments 8,886 10 (19) 7,125 10 (88)
Option trades 70 6 ― 70 5 ―
Futures contracts 31 ― ― 65 1 ―
Total 15,165 71 (22) 12,303 77 (89)
MSRs:
Interest rate contracts:
Receive fixed swaps 5,178 110 (27) 5,616 154 (1)
Pay fixed swaps 5,389 7 (94) 4,651 1 (111)
Option trades 14,510 363 (88) 9,640 273 (51)
Futures contracts 30 ― ― 38 ― ―
When issued securities, forward rate agreements and forward
commitments 2,406 2 ― 3,651 18 ―
Total 27,513 482 (209) 23,596 446 (163)
Total nonhedging derivatives 65,899 1,269 (980) 58,749 1,270 (1,036)
Total Derivatives $ 73,266 $ 1,451 $ (1,438) $ 67,581 $ 1,525 $ (1,506)
(1) Derivatives in a gain position are recorded as Other assets and derivatives in a loss position are recorded as Other liabilities on the Consolidated Balance
Sheets.
(2) Cash flow hedges are hedging the first unhedged forecasted settlements associated with the listed hedged item descriptions.