BB&T 2012 Annual Report Download - page 72
Download and view the complete annual report
Please find page 72 of the 2012 BB&T annual report below. You can navigate through the pages in the report by either clicking on the pages listed below, or by using the keyword search tool below to find specific information within the annual report.-
 1
1 -
2
-
3
-
4
-
5
-
6
-
7
-
8
-
9
-
10
-
11
-
12
-
13
-
14
-
15
-
16
-
17
-
18
-
19
-
20
-
21
-
22
-
23
-
24
-
25
-
26
-
27
-
28
-
29
-
30
-
31
-
32
-
33
-
34
-
35
-
36
-
37
-
38
-
39
-
40
-
41
-
42
-
43
-
44
-
45
-
46
-
47
-
48
-
49
-
50
-
51
-
52
-
53
-
54
-
55
-
56
-
57
-
58
-
59
-
60
-
61
-
 62
62 -
 63
63 -
 64
64 -
 65
65 -
 66
66 -
 67
67 -
 68
68 -
 69
69 -
 70
70 -
 71
71 -
 72
72 -
 73
73 -
 74
74 -
 75
75 -
 76
76 -
 77
77 -
 78
78 -
 79
79 -
 80
80 -
 81
81 -
 82
82 -
83
-
84
-
85
-
86
-
87
-
88
-
89
-
90
-
91
-
92
-
93
-
94
-
95
-
96
-
97
-
98
-
99
-
100
-
101
-
102
-
103
-
104
-
105
-
106
-
107
-
108
-
109
-
110
-
111
-
112
-
113
-
114
-
115
-
116
-
117
-
118
-
119
-
120
-
121
-
122
-
123
-
124
-
125
-
126
-
127
-
128
-
129
-
130
-
131
-
132
-
133
-
134
-
135
-
136
-
137
-
138
-
139
-
140
-
141
-
142
-
143
-
144
-
145
-
146
-
147
-
148
-
149
-
150
-
151
-
152
-
153
-
154
-
155
-
156
-
157
-
158
-
159
-
160
-
161
-
162
-
163
-
164
-
165
-
166
-
167
-
168
-
169
-
170
-
171
-
172
-
173
-
174
-
175
-
176
 |
 |

50
Analysis of Financial Condition
A review of the Company’ s major balance sheet categories is presented below.
Investment Activities
BB&T’ s investment activities are governed internally by a written, board-approved policy. The investment policy is carried
out by the MRLCC, which meets regularly to review the economic environment and establish investment strategies. The
MRLCC also has much broader responsibilities, which are discussed in the “Market Risk Management” section in
“Management’ s Discussion and Analysis of Financial Condition and Results of Operations” herein.
Investment strategies are reviewed by the MRLCC based on the interest rate environment, balance sheet mix, actual and
anticipated loan demand, funding opportunities and the overall interest rate sensitivity of the Company. In general, the
investment portfolio is managed in a manner appropriate to the attainment of the following goals: (i) to provide a sufficient
margin of liquid assets to meet unanticipated deposit and loan fluctuations and overall funds management objectives; (ii) to
provide eligible securities to secure public funds, trust deposits as prescribed by law and other borrowings; and (iii) to earn
the maximum return on funds invested that is commensurate with meeting the requirements of (i) and (ii).
Branch Bank invests in securities as allowable under bank regulations. These securities may include obligations of the U.S.
Treasury, U.S. government agencies, GSEs (including RMBS), bank eligible obligations of any state or political subdivision,
non-agency RMBS, structured notes, bank eligible corporate obligations (including corporate debentures), commercial paper,
negotiable CDs, bankers acceptances, mutual funds and limited types of equity securities. Branch Bank also may deal in
securities subject to the provisions of the Gramm-Leach-Bliley Act. BB&T’ s full-service brokerage and investment banking
subsidiary engages in the underwriting, trading and sales of equity and debt securities subject to the risk management policies
of the Company.
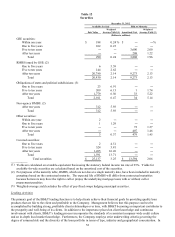
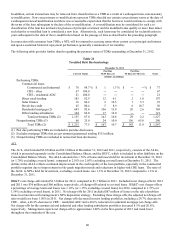
The following table provides information regarding the composition of BB&T’ s available-for-sale and held to maturity
securities portfolio for the years presented:
Table 11
Composition of Securities Portfolio
December 31,
2012 2011 2010
(Dollars in millions)
Securities available for sale (at fair value):
GSE securities $ 290 $ 306 $ 103
RMBS issued by GSE 20,930 18,132 18,344
States and political subdivisions 2,011 1,923 1,909
N
on-agency RMBS 312 368 515
Other securities 3 7 759
Covered securities 1,591 1,577 1,539
Total securities available for sale 25,137 22,313 23,169
Securities held to maturity (at amortized cost):
GSE securities 3,808 500 ―
RMBS issued by GSE 9,273 13,028 ―
States and political subdivisions 34 35 ―
Other securities 479 531 ―
Total securities held to maturity 13,594 14,094 ―
Total securities $ 38,731 $ 36,407 $ 23,169
The total securities portfolio increased $2.3 billion, or 6.4%, in 2012. This growth was primarily driven by purchases of
investment securities in the fourth quarter of 2012 that were made in response to slowing loan growth forecasts.
As of December 31, 2012, approximately 18.3% of the securities portfolio was variable rate. The effective duration of the
securities portfolio was 2.8 years at December 31, 2012 compared to 3.3 years at the end of 2011. The duration of the
securities portfolio excludes equity securities, auction rate securities, and certain covered non-agency RMBS. During the
first quarter of 2011, BB&T reclassified approximately $8.3 billion from securities available for sale to securities held to
maturity. Management determined that it has both the positive intent and ability to hold these securities to maturity. The
reclassification of these securities was accounted for at fair value. Management transferred these securities to mitigate