BB&T 2012 Annual Report Download - page 77
Download and view the complete annual report
Please find page 77 of the 2012 BB&T annual report below. You can navigate through the pages in the report by either clicking on the pages listed below, or by using the keyword search tool below to find specific information within the annual report.-
 1
1 -
2
-
3
-
4
-
5
-
6
-
7
-
8
-
9
-
10
-
11
-
12
-
13
-
14
-
15
-
16
-
17
-
18
-
19
-
20
-
21
-
22
-
23
-
24
-
25
-
26
-
27
-
28
-
29
-
30
-
31
-
32
-
33
-
34
-
35
-
36
-
37
-
38
-
39
-
40
-
41
-
42
-
43
-
44
-
45
-
46
-
47
-
48
-
49
-
50
-
51
-
52
-
53
-
54
-
55
-
56
-
57
-
58
-
59
-
60
-
61
-
62
-
63
-
64
-
65
-
66
-
 67
67 -
 68
68 -
 69
69 -
 70
70 -
 71
71 -
 72
72 -
 73
73 -
 74
74 -
 75
75 -
 76
76 -
 77
77 -
 78
78 -
 79
79 -
 80
80 -
 81
81 -
 82
82 -
 83
83 -
 84
84 -
 85
85 -
 86
86 -
 87
87 -
88
-
89
-
90
-
91
-
92
-
93
-
94
-
95
-
96
-
97
-
98
-
99
-
100
-
101
-
102
-
103
-
104
-
105
-
106
-
107
-
108
-
109
-
110
-
111
-
112
-
113
-
114
-
115
-
116
-
117
-
118
-
119
-
120
-
121
-
122
-
123
-
124
-
125
-
126
-
127
-
128
-
129
-
130
-
131
-
132
-
133
-
134
-
135
-
136
-
137
-
138
-
139
-
140
-
141
-
142
-
143
-
144
-
145
-
146
-
147
-
148
-
149
-
150
-
151
-
152
-
153
-
154
-
155
-
156
-
157
-
158
-
159
-
160
-
161
-
162
-
163
-
164
-
165
-
166
-
167
-
168
-
169
-
170
-
171
-
172
-
173
-
174
-
175
-
176
 |
 |

55
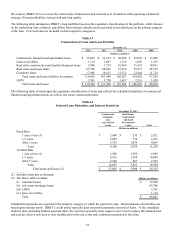
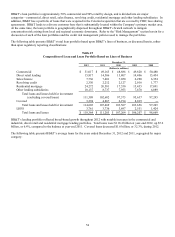
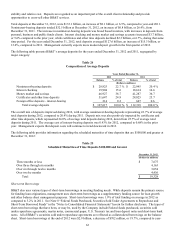
Table 16
Composition of Average Loans and Leases
Years Ended December 31,
2012 2011
Balance % of total Balance % of total
(Dollars in millions)
Commercial:
Commercial and industrial $ 36,966 32.4 % $ 34,153 32.2 %
CRE - other 10,779 9.5 11,139 10.5
CRE - residential ADC 1,665 1.5 2,769 2.6
Direct retail lending 15,270 13.4 13,850 13.1
Sales finance 7,680 6.8 7,202 6.8
Revolving credit 2,217 1.9 2,106 2.0
Residential mortgage 22,623 19.9 18,782 17.7
Other lending subsidiaries 9,525 8.4 8,280 7.8
Total average loans and leases held for
investment (excluding covered loans) 106,725 93.8 98,281 92.7
Covered 4,045 3.6 5,498 5.2
Total average loans and leases held
for investment 110,770 97.4 103,779 97.9
LHFS 2,963 2.6 2,183 2.1
Total average loans and leases $ 113,733 100.0 % $ 105,962 100.0 %
Average total loans were $113.7 billion for 2012, up $7.8 billion compared to the prior year. Average commercial and
industrial loans increased $2.8 billion, or 8.2%, in 2012 as compared to 2011. The increase in the commercial and industrial
portfolio was driven by investments in corporate banking in key national markets and the expansion of vertical lending teams
focused on targeted industries. Average CRE – other loans for 2012 decreased $360 million, or 3.2%, compared to 2011.
The average CRE – residential ADC portfolio declined $1.1 billion, or 39.9%, compared to the average balance for 2011, as
management continued to reduce exposure to higher risk real estate lending.
Average direct retail loans increased 10.3% during 2012, primarily due to increased demand for home equity loans and an
increase in non-real estate loans generated through the wealth and small business lending channels. This growth was
partially offset by continued runoff of the residential lot/land component of this portfolio as management has continued to
reduce exposures to these types of loans. Average sales finance loans and average revolving credit reflected 2012 growth
rates of 6.6% and 5.3%, respectively. BB&T concentrates its efforts on the highest quality borrowers in both of these product
markets. The growth in average sales finance loans was primarily driven by an increase in prime automobile lending, which
reflects increased momentum in the new and used automobile markets during 2012.
Average residential mortgage loans increased $3.8 billion, or 20.5%, compared to 2011. The increase in residential mortgage
loans was driven by a previous strategy that resulted in a higher portion of 10 to 15 year mortgage production being retained
in the held for investment loan portfolio. During the second quarter of 2012, this strategy was modified such that the
majority of future loan production is directed to the held for sale portfolio. As a result, management expects slower growth
in the residential mortgage loan portfolio during 2013.
Average loans held by BB&T’ s other lending subsidiaries increased $1.2 billion, or 15.0%, compared to 2011. The growth in
this portfolio was primarily in small ticket finance, equipment leasing and nonprime automobile financing.
Asset Quality
The following discussion excludes assets covered by FDIC loss sharing agreements that provide for reimbursement to BB&T
for the majority of losses incurred on those assets. Covered loans, which are considered performing due to the application of
the accretion method of accounting, were $3.3 billion at December 31, 2012 and $4.9 billion in the prior year. Covered
foreclosed property totaled $254 million and $378 million at December 31, 2012 and 2011, respectively.
NPAs, which include foreclosed real estate, repossessions and nonaccrual loans, totaled $1.5 billion at December 31, 2012,
compared to $2.5 billion at December 31, 2011. The decline in NPAs of $914 million was driven by a decrease of $492
million in NPLs and $422 million in foreclosed property. The decline in NPLs was broad-based, reflecting decreases in most
loan portfolios, including a 34.5% decrease in commercial NPLs. The decline in foreclosed property reflects a more