BB&T 2012 Annual Report Download - page 76
Download and view the complete annual report
Please find page 76 of the 2012 BB&T annual report below. You can navigate through the pages in the report by either clicking on the pages listed below, or by using the keyword search tool below to find specific information within the annual report.-
 1
1 -
2
-
3
-
4
-
5
-
6
-
7
-
8
-
9
-
10
-
11
-
12
-
13
-
14
-
15
-
16
-
17
-
18
-
19
-
20
-
21
-
22
-
23
-
24
-
25
-
26
-
27
-
28
-
29
-
30
-
31
-
32
-
33
-
34
-
35
-
36
-
37
-
38
-
39
-
40
-
41
-
42
-
43
-
44
-
45
-
46
-
47
-
48
-
49
-
50
-
51
-
52
-
53
-
54
-
55
-
56
-
57
-
58
-
59
-
60
-
61
-
62
-
63
-
64
-
65
-
 66
66 -
 67
67 -
 68
68 -
 69
69 -
 70
70 -
 71
71 -
 72
72 -
 73
73 -
 74
74 -
 75
75 -
 76
76 -
 77
77 -
 78
78 -
 79
79 -
 80
80 -
 81
81 -
 82
82 -
 83
83 -
 84
84 -
 85
85 -
 86
86 -
87
-
88
-
89
-
90
-
91
-
92
-
93
-
94
-
95
-
96
-
97
-
98
-
99
-
100
-
101
-
102
-
103
-
104
-
105
-
106
-
107
-
108
-
109
-
110
-
111
-
112
-
113
-
114
-
115
-
116
-
117
-
118
-
119
-
120
-
121
-
122
-
123
-
124
-
125
-
126
-
127
-
128
-
129
-
130
-
131
-
132
-
133
-
134
-
135
-
136
-
137
-
138
-
139
-
140
-
141
-
142
-
143
-
144
-
145
-
146
-
147
-
148
-
149
-
150
-
151
-
152
-
153
-
154
-
155
-
156
-
157
-
158
-
159
-
160
-
161
-
162
-
163
-
164
-
165
-
166
-
167
-
168
-
169
-
170
-
171
-
172
-
173
-
174
-
175
-
176
 |
 |

54
BB&T’ s loan portfolio is approximately 50% commercial and 50% retail by design, and is divided into six major
categories—commercial, direct retail, sales finance, revolving credit, residential mortgage and other lending subsidiaries. In
addition, BB&T has a portfolio of loans that were acquired in the Colonial acquisition that are covered by FDIC loss sharing
agreements. BB&T lends to a diverse customer base that is substantially located within the Company’ s primary market area.
At the same time, the loan portfolio is geographically dispersed throughout BB&T’ s branch network to mitigate
concentration risk arising from local and regional economic downturns. Refer to the “Risk Management” section herein for a
discussion of each of the loan portfolios and the credit risk management policies used to manage the portfolios.
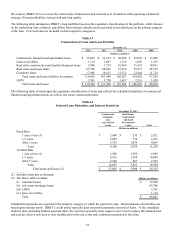
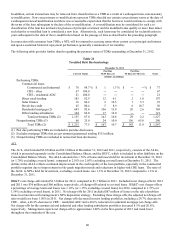
The following table presents BB&T’ s total loan portfolio based upon BB&T’ s lines of business, as discussed herein, rather
than upon regulatory reporting classifications:
Table 15
Composition of Loan and Lease Portfolio Based on Lines of Business
December 31,
2012 2011 2010 2009 2008
(Dollars in millions)
Commercial $ 51,017 $ 49,165 $ 48,886 $ 49,820 $ 50,480
Direct retail lending 15,817 14,506 13,807 14,406 15,454
Sales finance 7,736 7,401 7,050 6,290 6,354
Revolving credit 2,330 2,212 2,127 2,016 1,777
Residential mortgage 24,272 20,581 17,550 15,435 17,091
Other lending subsidiaries 10,137 8,737 7,953 7,670 6,089
Total loans and leases held for investment
(excluding covered loans) 111,309 102,602 97,373 95,637 97,245
Covered 3,294 4,867 6,194 8,019 ―
Total loans and leases held for investment 114,603 107,469 103,567 103,656 97,245
LHFS 3,761 3,736 3,697 2,551 1,424
Total loans and leases $ 118,364 $ 111,205 $ 107,264 $ 106,207 $ 98,669
BB&T’ s lending portfolio reflected broad-based growth throughout 2012 with notable increases in the commercial and
industrial, direct retail and residential mortgage lending portfolios. Total loans were $118.4 billion at year-end 2012, up $7.2
billion, or 6.4%, compared to the balance at year-end 2011. Covered loans decreased $1.6 billion, or 32.3%, during 2012.
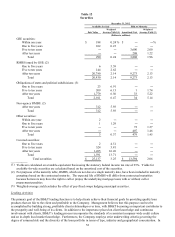
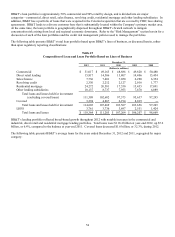
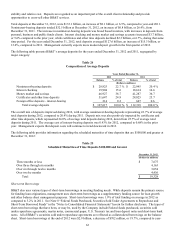
The following table presents BB&T’ s average loans for the years ended December 31, 2012 and 2011, segregated by major
category: