BB&T 2012 Annual Report Download - page 86
Download and view the complete annual report
Please find page 86 of the 2012 BB&T annual report below. You can navigate through the pages in the report by either clicking on the pages listed below, or by using the keyword search tool below to find specific information within the annual report.-
 1
1 -
2
-
3
-
4
-
5
-
6
-
7
-
8
-
9
-
10
-
11
-
12
-
13
-
14
-
15
-
16
-
17
-
18
-
19
-
20
-
21
-
22
-
23
-
24
-
25
-
26
-
27
-
28
-
29
-
30
-
31
-
32
-
33
-
34
-
35
-
36
-
37
-
38
-
39
-
40
-
41
-
42
-
43
-
44
-
45
-
46
-
47
-
48
-
49
-
50
-
51
-
52
-
53
-
54
-
55
-
56
-
57
-
58
-
59
-
60
-
61
-
62
-
63
-
64
-
65
-
66
-
67
-
68
-
69
-
70
-
71
-
72
-
73
-
74
-
75
-
 76
76 -
 77
77 -
 78
78 -
 79
79 -
 80
80 -
 81
81 -
 82
82 -
 83
83 -
 84
84 -
 85
85 -
 86
86 -
 87
87 -
 88
88 -
 89
89 -
 90
90 -
 91
91 -
 92
92 -
 93
93 -
 94
94 -
 95
95 -
 96
96 -
97
-
98
-
99
-
100
-
101
-
102
-
103
-
104
-
105
-
106
-
107
-
108
-
109
-
110
-
111
-
112
-
113
-
114
-
115
-
116
-
117
-
118
-
119
-
120
-
121
-
122
-
123
-
124
-
125
-
126
-
127
-
128
-
129
-
130
-
131
-
132
-
133
-
134
-
135
-
136
-
137
-
138
-
139
-
140
-
141
-
142
-
143
-
144
-
145
-
146
-
147
-
148
-
149
-
150
-
151
-
152
-
153
-
154
-
155
-
156
-
157
-
158
-
159
-
160
-
161
-
162
-
163
-
164
-
165
-
166
-
167
-
168
-
169
-
170
-
171
-
172
-
173
-
174
-
175
-
176
 |
 |

64
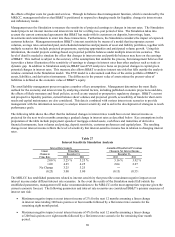
end 2011. Average short-term borrowings totaled $3.4 billion during 2012 compared to $5.2 billion last year, a decrease of
34.3%. The decline in the balances during 2012 primarily reflects the strong deposit growth described previously.
The following table summarizes certain pertinent information for the past three years with respect to BB&T’ s short-term
borrowings:
Table 26
Federal Funds Purchased, Securities Sold Under
Agreements to Repurchase and Short-Term Borrowed Funds
As Of / For The Years Ended December 31,
2012 2011 2010
(Dollars in millions)
Securities Sold Under Agreements to Repurchase:
Maximum outstanding at any month-end during the year $ 813 $ 1,176 $ 2,299
Balance outstanding at end of year 514 619 1,189
Average outstanding during the year 651 956 1,620
Average interest rate during the year 0.30 % 0.73 % 0.85 %
Average interest rate at end of year 0.33 0.31 0.96
Federal Funds Purchased and Short-Term Borrowed Funds:
Maximum outstanding at any month-end during the year $ 3,627 $ 9,350 $ 10,486
Balance outstanding at end of year 2,350 2,947 4,484
Average outstanding during the year 2,757 4,233 7,402
Average interest rate during the year 0.20 % 0.10 % 0.10 %
Average interest rate at end of year 0.19 0.17 0.32
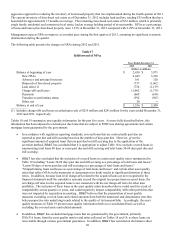
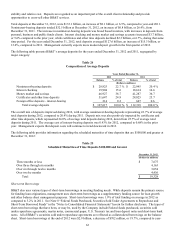
Long-term Debt
BB&T uses long-term debt to provide both funding and, to a lesser extent, regulatory capital. During 2012, long-term debt
represented 11.6% of average total funding, compared to 13.7% during 2011. At December 31, 2012, long-term debt totaled
$19.1 billion, a decrease of $2.7 billion compared to year-end 2011. The average cost of long-term debt was 3.02% in 2012,
compared to 3.40% in 2011. See Note 10 “Long-Term Debt” in the “Notes to Consolidated Financial Statements” herein for
further disclosure.
BB&T’ s long-term debt consists primarily of FHLB advances, which represented 47.1% of total outstanding long-term debt
at December 31, 2012; senior notes of BB&T, which represented 31.6% of the year-end balance; subordinated notes of
BB&T, which represented 11.3% of the year-end balance; and subordinated notes of Branch Bank, which represented 6.4%
of total outstanding long-term debt at December 31, 2012. FHLB advances are cost-effective long-term funding sources that
provide BB&T with the flexibility to structure the debt in a manner that aids in the management of interest rate risk and
liquidity.
The decrease in long-term debt reflects the redemption of $3.3 billion of junior subordinated debt and the maturity of $1.0
billion in senior debt. The redemption of the junior subordinated debt was initiated based on the early redemption provisions
of the related trust preferred securities due to the fact that they will no longer qualify for Tier 1 capital treatment.
These decreases in long-term debt were partially offset by the issuance of $2.3 billion of senior and subordinated notes with
interest rates ranging from 1.45% to 3.95%.
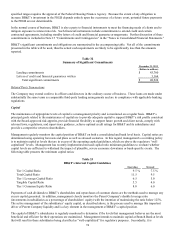
Shareholders’ Equity
Shareholders’ equity totaled $21.2 billion at December 31, 2012, an increase of $3.7 billion, or 21.4%, from year-end 2011.
BB&T’ s book value per common share at December 31, 2012 was $27.21, compared to $24.98 at December 31, 2011.
The increase in shareholders’ equity during 2012 includes $2.1 billion in net proceeds from the issuance of Tier 1 qualifying
non-cumulative perpetual preferred stock. See Note 11 “Shareholders’ Equity” in the “Notes to Consolidated Financial
Statements” herein for further disclosure. In addition, shareholders’ equity increased $1.4 billion due to BB&T’ s earnings
available to common shareholders retained after dividends declared, and $113 million as a result of the issuance of additional
shares and other transactions in connection with BB&T’ s equity-based compensation plans, 401(k) plan and dividend
reinvestment plan. Accumulated other comprehensive income increased $154 million. The increase in accumulated other
comprehensive income was primarily due to a $335 million after-tax increase in the value of the available for sale securities