BB&T 2012 Annual Report Download - page 7
Download and view the complete annual report
Please find page 7 of the 2012 BB&T annual report below. You can navigate through the pages in the report by either clicking on the pages listed below, or by using the keyword search tool below to find specific information within the annual report.-
 1
1 -
 2
2 -
 3
3 -
 4
4 -
 5
5 -
 6
6 -
 7
7 -
 8
8 -
 9
9 -
 10
10 -
 11
11 -
 12
12 -
 13
13 -
 14
14 -
 15
15 -
 16
16 -
 17
17 -
 18
18 -
19
-
20
-
21
-
22
-
23
-
24
-
25
-
26
-
27
-
28
-
29
-
30
-
31
-
32
-
33
-
34
-
35
-
36
-
37
-
38
-
39
-
40
-
41
-
42
-
43
-
44
-
45
-
46
-
47
-
48
-
49
-
50
-
51
-
52
-
53
-
54
-
55
-
56
-
57
-
58
-
59
-
60
-
61
-
62
-
63
-
64
-
65
-
66
-
67
-
68
-
69
-
70
-
71
-
72
-
73
-
74
-
75
-
76
-
77
-
78
-
79
-
80
-
81
-
82
-
83
-
84
-
85
-
86
-
87
-
88
-
89
-
90
-
91
-
92
-
93
-
94
-
95
-
96
-
97
-
98
-
99
-
100
-
101
-
102
-
103
-
104
-
105
-
106
-
107
-
108
-
109
-
110
-
111
-
112
-
113
-
114
-
115
-
116
-
117
-
118
-
119
-
120
-
121
-
122
-
123
-
124
-
125
-
126
-
127
-
128
-
129
-
130
-
131
-
132
-
133
-
134
-
135
-
136
-
137
-
138
-
139
-
140
-
141
-
142
-
143
-
144
-
145
-
146
-
147
-
148
-
149
-
150
-
151
-
152
-
153
-
154
-
155
-
156
-
157
-
158
-
159
-
160
-
161
-
162
-
163
-
164
-
165
-
166
-
167
-
168
-
169
-
170
-
171
-
172
-
173
-
174
-
175
-
176
 |
 |

2012 Annual Report
5
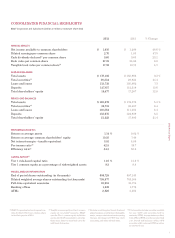
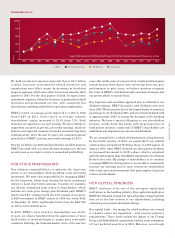
2012 RESULTS
BB&T had an outstanding year in 2012. We achieved record net
income available to common shareholders and strong growth in
noninterest income, led by record performances in mortgage
banking, insurance and investment banking and brokerage.
We continued to produce broad-based improvement in credit
quality. We sustained balanced and broad-based loan growth
despite a still-slow economy and improved the growth, mix
and cost of our deposits. Our net interest margin remained
strong, and we held noninterest expenses essentially flat while
successfully completing our BankAtlantic and Crump Group
acquisitions. With increasing and diverse sources of revenue,
we believe BB&T is positioned for another high-performance
year in 2013.
Net income available to common shareholders for 2012
increased by 49% from 2011 to $1.9 billion. Earnings per
diluted common share totaled $2.70, compared with $1.83
earned in 2011, an increase of 48%. Total revenues increased
12.0% to $9.8 billion in 2012 compared with 2011.
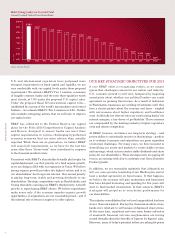
Average loans and leases increased by 7.3% in 2012 over
2011, exceeding the 6.1% average growth of our peer group.
Commercial and industrial, direct retail and residential
mortgage loans led BB&T’s broad-based growth. We are
encouraged by increasing loan production from our Community
Bank, up 26% over last year, with strong gains in our newer
Florida, Texas and Alabama markets added through the
Colonial acquisition. Although many of those commitments
are not funded yet, we believe production is a good indicator of
future growth if there is a pickup in momentum in the economy.
Our average deposit growth of 13.6% outpaced all of our
peers, which had an average growth rate of 6.9%. We were
particularly pleased that BB&T’s average noninterest-bearing
deposits grew by 26.1% for the year, showing the success of our
strategy to change our deposit mix with lower deposit costs.
We anticipate more modest deposit growth in the first quarter
of 2013 with continued improvement in deposit costs.
BB&T’s credit-quality measures also continued to improve.
Total nonperforming assets as a percentage of average assets
decreased each quarter in 2012 to 0.85% at year end excluding
covered assets, the lowest level since the second quarter of 2008
and superior to the 1.08% average of BB&T’s peers. We expect
continued improvement at a modest pace in the first quarter
of 2013, assuming no significant deterioration in the economy.
Net charge-offs, excluding covered loans, also improved each
quarter of 2012 to 1.04% in the fourth quarter, a four-year
low. In the first quarter of 2013, we anticipate net charge-offs
to approximate 1.00% of average loans, and trend lower during
the year. In addition, our foreclosed real estate balance has
fallen to a five-year low.
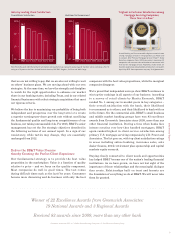
BB&T’s fully taxable equivalent net interest income totaled
$6.0 billion in 2012, a 6.2% increase from 2011. Our net
interest margin remained strong at 3.91% for 2012, comparing
favorably with the 3.45% average of our peers. We do expect
the margin to decline somewhat in 2013. Improvement
in BB&T’s deposit mix is being offset by continued pressure on
our asset yields from the very low interest-rate environment
and anticipated runoff of covered assets acquired as part of
the Colonial transaction. The net interest margin, key to a
bank’s profitability, is the difference between the interest
received on loans and investments and the interest paid
on deposits and other funding, expressed as a percentage
of average earning assets.
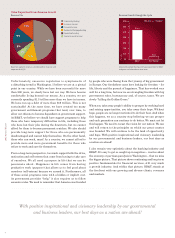
Our noninterest income totaled $3.8 billion, a 22.7% increase
over 2011. Insurance income benefited from a somewhat
stronger pricing market and the acquisition of Crump Group.
Mortgage banking income increased with higher gains
on residential mortgage production and sales. Investment
banking and brokerage fees and commissions grew because
of improved financial market conditions. BB&T’s fee income
ratio improved to 42.5% for the year, up from 39.7% for 2011
and compared favorably with our peer average of 38.0%.
The ratio reflects our continued success in diversifying our
sources of revenue.
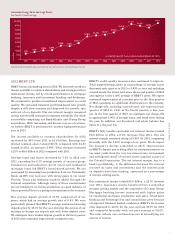
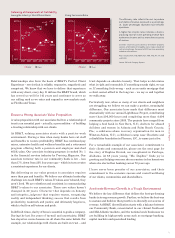
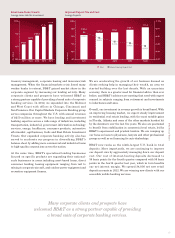
Excludes foreclosed property expense, provision for loan and lease losses, and securities gains (losses).
Pre-Tax Pre-Credit Earnings
Consistent Long-Term Earnings Power
As originally reported 15-year compound annual growth rate 13.3%