BB&T 2012 Annual Report Download - page 149
Download and view the complete annual report
Please find page 149 of the 2012 BB&T annual report below. You can navigate through the pages in the report by either clicking on the pages listed below, or by using the keyword search tool below to find specific information within the annual report.-
 1
1 -
2
-
3
-
4
-
5
-
6
-
7
-
8
-
9
-
10
-
11
-
12
-
13
-
14
-
15
-
16
-
17
-
18
-
19
-
20
-
21
-
22
-
23
-
24
-
25
-
26
-
27
-
28
-
29
-
30
-
31
-
32
-
33
-
34
-
35
-
36
-
37
-
38
-
39
-
40
-
41
-
42
-
43
-
44
-
45
-
46
-
47
-
48
-
49
-
50
-
51
-
52
-
53
-
54
-
55
-
56
-
57
-
58
-
59
-
60
-
61
-
62
-
63
-
64
-
65
-
66
-
67
-
68
-
69
-
70
-
71
-
72
-
73
-
74
-
75
-
76
-
77
-
78
-
79
-
80
-
81
-
82
-
83
-
84
-
85
-
86
-
87
-
88
-
89
-
90
-
91
-
92
-
93
-
94
-
95
-
96
-
97
-
98
-
99
-
100
-
101
-
102
-
103
-
104
-
105
-
106
-
107
-
108
-
109
-
110
-
111
-
112
-
113
-
114
-
115
-
116
-
117
-
118
-
119
-
120
-
121
-
122
-
123
-
124
-
125
-
126
-
127
-
128
-
129
-
130
-
131
-
132
-
133
-
134
-
135
-
136
-
137
-
138
-
 139
139 -
 140
140 -
 141
141 -
 142
142 -
 143
143 -
 144
144 -
 145
145 -
 146
146 -
 147
147 -
 148
148 -
 149
149 -
 150
150 -
 151
151 -
 152
152 -
 153
153 -
 154
154 -
 155
155 -
 156
156 -
 157
157 -
 158
158 -
 159
159 -
160
-
161
-
162
-
163
-
164
-
165
-
166
-
167
-
168
-
169
-
170
-
171
-
172
-
173
-
174
-
175
-
176
 |
 |

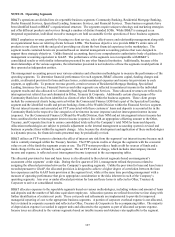
127
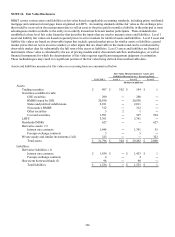
Fair Value Measurements for Assets and
Liabilities Measured on a Recurring Basis
12/31/2011 Level 1 Level 2 Level 3
(Dollars in millions)
Assets:
Trading securities $ 534 $ 298 $ 235 $ 1
Securities available for sale:
GSE securities 306 ― 306 ―
RMBS issued by GSE 18,132 ― 18,132 ―
States and political subdivisions 1,923 ― 1,923 ―
N
on-agency RMBS 368 ― 368 ―
Other securities 7 6 1 ―
Covered securities 1,577 ― 593 984
LHFS 3,736 ― 3,736 ―
Residential MSRs 563 ― ― 563
Derivative assets: (1)
Interest rate contracts 1,518 1 1,457 60
Foreign exchange contracts 7 ― 7 ―
Private equity and similar investments (1)(2) 261 ― ― 261
Total assets $ 28,932 $ 305 $ 26,758 $ 1,869
Liabilities:
Derivative liabilities: (1)
Interest rate contracts $ 1,498 $ ―$ 1,497 $ 1
Foreign exchange contracts 8 ― 8 ―
Short-term borrowed funds (3) 118 ― 118 ―
Total liabilities $ 1,624 $ ―$ 1,623 $ 1
(1) These amounts are reflected in other assets and other liabilities on the Consolidated Balance Sheets.
(2) Based on an analysis of the nature and risks of these investments, BB&T has determined that presenting these
investments as a single class is appropriate.
(3) Short-term borrowed funds reflect securities sold short positions.
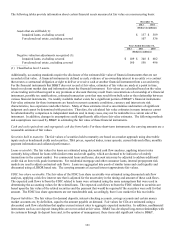
The following discussion focuses on the valuation techniques and significant inputs used by BB&T in determining the Level
2 and Level 3 fair values of each significant class of assets and liabilities.
BB&T generally utilizes a third-party pricing service in determining the fair value of its securities portfolio. Fair value
measurements are derived from market-based pricing matrices that were developed using observable inputs that include
benchmark yields, benchmark securities, reported trades, offers, bids, issuer spreads and broker quotes. As described by
security type below, additional inputs may be used, or some inputs may not be applicable. In the event that market
observable data was not available, which would generally occur due to the lack of an active market for a given security, the
valuation of the security would be subjective and may involve substantial judgment by management.
Specific valuation techniques and inputs used in determining the fair value of each significant class of assets and liabilities
follows:
Trading securities: Trading securities are composed of all types of debt and equity securities, but the majority consists of
debt securities issued by the U.S. Treasury, GSEs, or states and political subdivisions. The valuation techniques used for
these investments are more fully discussed below.
GSE securities and RMBS issued by GSE: These are debt securities issued by GSEs. GSE pass-through securities are valued
using market-based pricing matrices that are based on observable inputs including benchmark TBA security pricing and yield
curves that were estimated based on U.S. Treasury yields and certain floating rate indices. The pricing matrices for these
securities may also give consideration to pool-specific data supplied directly by the GSE. GSE CMOs are valued using
market-based pricing matrices that are based on observable inputs including offers, bids, reported trades, dealer quotes and
market research reports, the characteristics of a specific tranche, market convention prepayment speeds and benchmark yield
curves as described above.
States and political subdivisions: These securities are valued using market-based pricing matrices that are based on
observable inputs including MSRB reported trades, issuer spreads, material event notices and benchmark yield curves.