BB&T 2012 Annual Report Download - page 53
Download and view the complete annual report
Please find page 53 of the 2012 BB&T annual report below. You can navigate through the pages in the report by either clicking on the pages listed below, or by using the keyword search tool below to find specific information within the annual report.-
 1
1 -
2
-
3
-
4
-
5
-
6
-
7
-
8
-
9
-
10
-
11
-
12
-
13
-
14
-
15
-
16
-
17
-
18
-
19
-
20
-
21
-
22
-
23
-
24
-
25
-
26
-
27
-
28
-
29
-
30
-
31
-
32
-
33
-
34
-
35
-
36
-
37
-
38
-
39
-
40
-
41
-
42
-
 43
43 -
 44
44 -
 45
45 -
 46
46 -
 47
47 -
 48
48 -
 49
49 -
 50
50 -
 51
51 -
 52
52 -
 53
53 -
 54
54 -
 55
55 -
 56
56 -
 57
57 -
 58
58 -
 59
59 -
 60
60 -
 61
61 -
 62
62 -
 63
63 -
64
-
65
-
66
-
67
-
68
-
69
-
70
-
71
-
72
-
73
-
74
-
75
-
76
-
77
-
78
-
79
-
80
-
81
-
82
-
83
-
84
-
85
-
86
-
87
-
88
-
89
-
90
-
91
-
92
-
93
-
94
-
95
-
96
-
97
-
98
-
99
-
100
-
101
-
102
-
103
-
104
-
105
-
106
-
107
-
108
-
109
-
110
-
111
-
112
-
113
-
114
-
115
-
116
-
117
-
118
-
119
-
120
-
121
-
122
-
123
-
124
-
125
-
126
-
127
-
128
-
129
-
130
-
131
-
132
-
133
-
134
-
135
-
136
-
137
-
138
-
139
-
140
-
141
-
142
-
143
-
144
-
145
-
146
-
147
-
148
-
149
-
150
-
151
-
152
-
153
-
154
-
155
-
156
-
157
-
158
-
159
-
160
-
161
-
162
-
163
-
164
-
165
-
166
-
167
-
168
-
169
-
170
-
171
-
172
-
173
-
174
-
175
-
176
 |
 |
31
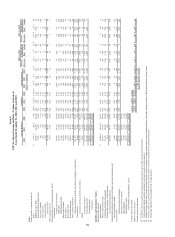
Consolidated net income available to common shareholders for 2012 totaled $1.9 billion, an increase of $627 million, or
48.6%, compared to $1.3 billion earned during 2011. On a diluted per common share basis, earnings for 2012 were $2.70,
compared to $1.83 for 2011. BB&T’ s results of operations for 2012 produced a return on average assets of 1.14% and a
return on average common shareholders’ equity of 10.35% compared to prior year ratios of 0.82% and 7.49%, respectively.
BB&T’ s revenues for 2012 were $9.8 billion on a FTE basis, up 12.1% compared to 2011. The increase in revenues was
broad based, with $350 million of the increase attributable to higher net interest income and $707 million related to an
increase in noninterest income. Net interest income on a FTE basis was up 6.2% compared to 2011, primarily the result of a
23.1% decrease in interest expense compared to 2011. Noninterest income increased 22.7% compared to 2011, largely the
result of record insurance, mortgage banking and investment banking and brokerage commission revenues.
Credit costs continued to improve during 2012 as NPAs, excluding covered foreclosed property, declined $914 million, or
37.3%, compared to 2011. This decline included a $492 million decrease in NPLs and a $422 million decrease in foreclosed
real estate and other property. Net charge-offs for 2012, excluding covered, were $1.3 billion, a decrease of $334 million, or
21.0%, compared to the prior year. BB&T recorded a $1.0 billion provision for credit losses in 2012, excluding covered,
compared to $1.1 billion in the prior year. The ratio of the ALLL to net charge-offs excluding covered was 1.50x for 2012
compared to 1.32x in 2011. Foreclosed property expenses declined $536 million, or 66.8%, during 2012, reflecting the
impact of a more aggressive approach to reducing the inventory of foreclosed property that was implemented during the
fourth quarter of 2011.
BB&T’ s total assets at December 31, 2012 were $183.9 billion, an increase of $9.3 billion, or 5.3%, compared to December
31, 2011. The growth in total assets includes an increase of $7.2 billion in total loans and leases and $2.3 billion in the total
securities portfolio. The growth in the loan and lease portfolio reflects broad-based growth, led by increases in the residential
mortgage, commercial and industrial and direct retail lending portfolios. The increase in the total securities portfolio is
primarily the result of purchases of investment securities that were made in the fourth quarter of 2012 in response to slowing
loan growth forecasts.
Total deposits at December 31, 2012 were $133.1 billion, an increase of $8.1 billion, or 6.5%, from December 31, 2011. The
increase in deposits was led by noninterest-bearing deposits, which increased $6.8 billion, or 26.4%, and money market and
savings accounts, which increased $3.3 billion, or 7.4%. These increases were partially offset by a decrease in certificates
and other time deposits totaling $2.3 billion. These changes resulted in a substantial improvement to deposit mix, with
noninterest-bearing accounts representing 24.4% of total deposits at December 31, 2012, compared to 20.6% at December
31, 2011. The cost of interest-bearing deposits for 2012 declined to 0.43%, a decline of 25 basis points from 0.68% for 2011.
Total shareholders’ equity increased 21.4% compared to December 31, 2011. This increase was primarily driven by net
proceeds of $2.1 billion of Tier 1 qualifying non-cumulative perpetual preferred stock during 2012 and net income retained
after dividends declared. The Tier 1 common ratio was 9.3% at December 31, 2012, compared to 9.4% at December 31,
2011. In addition, the Tier 1 risk-based capital and total risk-based capital ratios were 11.0% and 13.9% at December 31,
2012, respectively. BB&T’ s risk-based and tangible capital ratios remain well above regulatory standards for well-
capitalized banks. As of December 31, 2012, measures of tangible capital were not required by the regulators and, therefore,
were considered non-GAAP measures. Refer to the section titled “Capital” herein for a discussion of how BB&T calculates
and uses these measures in the evaluation of the Company.
Reclassifications
In certain circumstances, reclassifications have been made to prior period information to conform to the 2012 presentation.
Such reclassifications had no effect on previously reported shareholders’ equity or net income.
Critical Accounting Policies
The accounting and reporting policies of BB&T are in accordance with GAAP and conform to the accounting and reporting
guidelines prescribed by bank regulatory authorities. The financial position and results of operations are affected by
management’ s application of accounting policies, including estimates, assumptions and judgments made to arrive at the
carrying value of assets and liabilities and amounts reported for revenues and expenses. Different assumptions in the
application of these policies could result in material changes in the consolidated financial position and/or consolidated results
of operations and related disclosures. The more critical accounting and reporting policies include those related to the ACL,
determining fair value of financial instruments, intangible assets and other purchase accounting related adjustments
associated with mergers and acquisitions, costs and benefit obligations associated with BB&T’ s pension and postretirement
benefit plans, and income taxes. Understanding BB&T’ s accounting policies is fundamental to understanding the
consolidated financial position and consolidated results of operations. Accordingly, BB&T’ s significant accounting policies