BB&T 2012 Annual Report Download - page 162
Download and view the complete annual report
Please find page 162 of the 2012 BB&T annual report below. You can navigate through the pages in the report by either clicking on the pages listed below, or by using the keyword search tool below to find specific information within the annual report.-
 1
1 -
2
-
3
-
4
-
5
-
6
-
7
-
8
-
9
-
10
-
11
-
12
-
13
-
14
-
15
-
16
-
17
-
18
-
19
-
20
-
21
-
22
-
23
-
24
-
25
-
26
-
27
-
28
-
29
-
30
-
31
-
32
-
33
-
34
-
35
-
36
-
37
-
38
-
39
-
40
-
41
-
42
-
43
-
44
-
45
-
46
-
47
-
48
-
49
-
50
-
51
-
52
-
53
-
54
-
55
-
56
-
57
-
58
-
59
-
60
-
61
-
62
-
63
-
64
-
65
-
66
-
67
-
68
-
69
-
70
-
71
-
72
-
73
-
74
-
75
-
76
-
77
-
78
-
79
-
80
-
81
-
82
-
83
-
84
-
85
-
86
-
87
-
88
-
89
-
90
-
91
-
92
-
93
-
94
-
95
-
96
-
97
-
98
-
99
-
100
-
101
-
102
-
103
-
104
-
105
-
106
-
107
-
108
-
109
-
110
-
111
-
112
-
113
-
114
-
115
-
116
-
117
-
118
-
119
-
120
-
121
-
122
-
123
-
124
-
125
-
126
-
127
-
128
-
129
-
130
-
131
-
132
-
133
-
134
-
135
-
136
-
137
-
138
-
139
-
140
-
141
-
142
-
143
-
144
-
145
-
146
-
147
-
148
-
149
-
150
-
151
-
 152
152 -
 153
153 -
 154
154 -
 155
155 -
 156
156 -
 157
157 -
 158
158 -
 159
159 -
 160
160 -
 161
161 -
 162
162 -
 163
163 -
 164
164 -
 165
165 -
 166
166 -
 167
167 -
 168
168 -
 169
169 -
 170
170 -
 171
171 -
 172
172 -
173
-
174
-
175
-
176
 |
 |

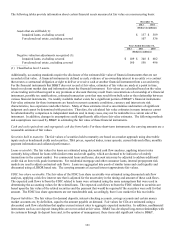
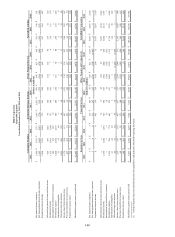
BB&T Corporation
Reportable Segments
Years Ended December 31, 2012, 2011 and 2010
Community Banking Residential Mortgage Banking Dealer Financial Services Specialized Lending
2012 2011 2010 2012 2011 2010 2012 2011 2010 2012 2011 2010
(Dollars in millions)
N
et interest income (expense) $ 2,086 $ 1,937 $ 1,771 $ 1,148 $ 1,025 $ 981 $ 845 $ 852 $ 858 $ 701 $ 636 $ 591
N
et intersegment interest income (expense) 1,342 1,642 2,033 (776) (734) (721) (216) (270) (344) (154) (171) (184)
Segment net interest income 3,428 3,579 3,804 372 291 260 629 582 514 547 465 407
Allocated provision for loan and lease losses 666 589 1,801 95 320 553 164 125 93 137 72 110
N
oninterest income 1,125 1,016 1,200 753 349 457 7 7 4 228 211 176
Intersegment net referral fees (expense) 182 132 146 (1) ― ― ― ― ― ― ― ―
N
oninterest expense 1,828 2,354 2,373 388 296 254 101 90 90 256 233 218
Amortization of intangibles 37 47 66 ― ― ― 1 1 1 5 6 6
Allocated corporate expenses 1,025 899 799 54 48 33 36 37 37 79 72 62
Income (loss) before income taxes 1,179 838 111 587 (24) (123) 334 336 297 298 293 187
Provision (benefit) for income taxes 427 302 35 221 (9) (46) 126 127 112 63 58 19
Segment net income (loss) $ 752 $ 536 $ 76 $ 366 $ (15) $ (77) $ 208 $ 209 $ 185 $ 235 $ 235 $ 168
Identifiable segment assets (period end) $ 62,945 $ 61,072 $ 63,244 $ 29,391 $ 25,471 $ 22,183 $ 10,264 $ 9,874 $ 9,418 $ 18,907 $ 16,766 $ 14,945
Insurance Services Financial Services Other, Treasury and Corporate (1) Total BB&T Corporation
2012 2011 2010 2012 2011 2010 2012 2011 2010 2012 2011 2010
(Dollars in millions)
N
et interest income (expense) $ 3 $ 3 $ 3 $ 119 $ 107 $ 99 $ 955 $ 947 $ 1,017 $ 5,857 $ 5,507 $ 5,320
N
et intersegment interest income (expense) 3 4 6 332 267 215 (531) (738) (1,005) ― ― ―
Segment net interest income 6 7 9 451 374 314 424 209 12 5,857 5,507 5,320
Allocated provision for loan and lease losses ― ― ― 10 (1) 45 (15) 85 36 1,057 1,190 2,638
N
oninterest income 1,365 1,040 1,033 725 694 657 (383) (204) 430 3,820 3,113 3,957
Intersegment net referral fees (expense) ― ― ― 29 20 16 (210) (152) (162) ― ― ―
N
oninterest expense 1,015 786 774 641 574 527 1,489 1,370 1,312 5,718 5,703 5,548
Amortization of intangibles 61 42 45 3 3 3 3 ― 1 110 99 122
Allocated corporate expenses 82 72 68 94 75 39 (1,370) (1,203) (1,038) ― ― ―
Income (loss) before income taxes 213 147 155 457 437 373 (276) (399) (31) 2,792 1,628 969
Provision (benefit) for income taxes 69 46 52 171 164 139 (313) (392) (196) 764 296 115
Segment net income (loss) $ 144 $ 101 $ 103 $ 286 $ 273 $ 234 $ 37 $ (7) $ 165 $ 2,028 $ 1,332 $ 854
Identifiable segment assets (period end) $ 3,297 $ 2,350 $ 2,294 $ 9,184 $ 7,413 $ 6,053 $ 49,884 $ 51,633 $ 38,944 $ 183,872 $ 174,579 $ 157,081
(1) Includes financial data from subsidiaries below the quantitative and qualitative thresholds requiring disclosure.
140