BB&T 2012 Annual Report Download - page 30
Download and view the complete annual report
Please find page 30 of the 2012 BB&T annual report below. You can navigate through the pages in the report by either clicking on the pages listed below, or by using the keyword search tool below to find specific information within the annual report.-
 1
1 -
2
-
3
-
4
-
5
-
6
-
7
-
8
-
9
-
10
-
11
-
12
-
13
-
14
-
15
-
16
-
17
-
18
-
19
-
 20
20 -
 21
21 -
 22
22 -
 23
23 -
 24
24 -
 25
25 -
 26
26 -
 27
27 -
 28
28 -
 29
29 -
 30
30 -
 31
31 -
 32
32 -
 33
33 -
 34
34 -
 35
35 -
 36
36 -
 37
37 -
 38
38 -
 39
39 -
 40
40 -
41
-
42
-
43
-
44
-
45
-
46
-
47
-
48
-
49
-
50
-
51
-
52
-
53
-
54
-
55
-
56
-
57
-
58
-
59
-
60
-
61
-
62
-
63
-
64
-
65
-
66
-
67
-
68
-
69
-
70
-
71
-
72
-
73
-
74
-
75
-
76
-
77
-
78
-
79
-
80
-
81
-
82
-
83
-
84
-
85
-
86
-
87
-
88
-
89
-
90
-
91
-
92
-
93
-
94
-
95
-
96
-
97
-
98
-
99
-
100
-
101
-
102
-
103
-
104
-
105
-
106
-
107
-
108
-
109
-
110
-
111
-
112
-
113
-
114
-
115
-
116
-
117
-
118
-
119
-
120
-
121
-
122
-
123
-
124
-
125
-
126
-
127
-
128
-
129
-
130
-
131
-
132
-
133
-
134
-
135
-
136
-
137
-
138
-
139
-
140
-
141
-
142
-
143
-
144
-
145
-
146
-
147
-
148
-
149
-
150
-
151
-
152
-
153
-
154
-
155
-
156
-
157
-
158
-
159
-
160
-
161
-
162
-
163
-
164
-
165
-
166
-
167
-
168
-
169
-
170
-
171
-
172
-
173
-
174
-
175
-
176
 |
 |

8
Retail Services: Commercial Services:
Asset management Asset management
Automobile lending Association services
Bankcard lending Capital markets services
Consumer finance Commercial deposit services
Home equity lending Commercial finance
Home mortgage lending Commercial middle market lending
Insurance Commercial mortgage lending
Investment brokerage services Institutional trust services
Mobile/online banking Insurance
Payment solutions Insurance premium finance
Retail deposit services International banking services
Sales finance Leasing
Small business lending Merchant services
Wealth management/private banking Mortgage warehouse lending
Payment solutions
Real estate lending
Supply chain management
Private equity investments
M
arket Area
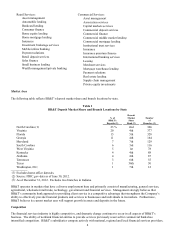
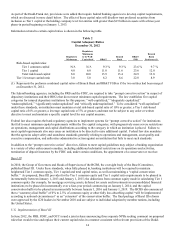
The following table reflects BB&T’ s deposit market share and branch locations by state.
Table 1
BB&T Deposit Market Share and Branch Locations by State
Deposit
% of Market Number
BB&T's Share of
Deposits (2) Rank (2) Branches (3)
N
orth Carolina (1) 23 % 2nd 366
Virginia 20 4th 377
Florida 15 5th 328
Georgia 11 4th 164
Maryland 7 7th 129
South Carolina 6 3rd 116
West Virginia 5 1st 78
Kentucky 4 4th 88
Alabama 4 4th 87
Tennessee 3 6th 55
Texas 1 36th 30
Washington, D.C. 1 7th 12
(1) Excludes home office deposits.
(2) Source: FDIC.gov-data as of June 30, 2012.
(3) As of December 31, 2012. Excludes two branches in Indiana.
BB&T operates in markets that have a diverse employment base and primarily consist of manufacturing, general services,
agricultural, wholesale/retail trade, technology, government and financial services. Management strongly believes that
BB&T’ s community bank approach to providing client service is a competitive advantage that strengthens the Company’ s
ability to effectively provide financial products and services to businesses and individuals in its markets. Furthermore,
BB&T believes its current market area will support growth in assets and deposits in the future.
Competition
The financial services industry is highly competitive, and dramatic change continues to occur in all aspects of BB&T’ s
business. The ability of nonbank financial entities to provide services previously reserved for commercial banks has
intensified competition. BB&T’ s subsidiaries compete actively with national, regional and local financial services providers,