BB&T 2012 Annual Report Download - page 56
Download and view the complete annual report
Please find page 56 of the 2012 BB&T annual report below. You can navigate through the pages in the report by either clicking on the pages listed below, or by using the keyword search tool below to find specific information within the annual report.-
 1
1 -
2
-
3
-
4
-
5
-
6
-
7
-
8
-
9
-
10
-
11
-
12
-
13
-
14
-
15
-
16
-
17
-
18
-
19
-
20
-
21
-
22
-
23
-
24
-
25
-
26
-
27
-
28
-
29
-
30
-
31
-
32
-
33
-
34
-
35
-
36
-
37
-
38
-
39
-
40
-
41
-
42
-
43
-
44
-
45
-
 46
46 -
 47
47 -
 48
48 -
 49
49 -
 50
50 -
 51
51 -
 52
52 -
 53
53 -
 54
54 -
 55
55 -
 56
56 -
 57
57 -
 58
58 -
 59
59 -
 60
60 -
 61
61 -
 62
62 -
 63
63 -
 64
64 -
 65
65 -
 66
66 -
67
-
68
-
69
-
70
-
71
-
72
-
73
-
74
-
75
-
76
-
77
-
78
-
79
-
80
-
81
-
82
-
83
-
84
-
85
-
86
-
87
-
88
-
89
-
90
-
91
-
92
-
93
-
94
-
95
-
96
-
97
-
98
-
99
-
100
-
101
-
102
-
103
-
104
-
105
-
106
-
107
-
108
-
109
-
110
-
111
-
112
-
113
-
114
-
115
-
116
-
117
-
118
-
119
-
120
-
121
-
122
-
123
-
124
-
125
-
126
-
127
-
128
-
129
-
130
-
131
-
132
-
133
-
134
-
135
-
136
-
137
-
138
-
139
-
140
-
141
-
142
-
143
-
144
-
145
-
146
-
147
-
148
-
149
-
150
-
151
-
152
-
153
-
154
-
155
-
156
-
157
-
158
-
159
-
160
-
161
-
162
-
163
-
164
-
165
-
166
-
167
-
168
-
169
-
170
-
171
-
172
-
173
-
174
-
175
-
176
 |
 |

34
Acquisitions typically result in goodwill, which is subject to ongoing periodic impairment tests based on the fair values of the
reporting units to which the acquired goodwill relates. Refer to Note 1 “Summary of Significant Accounting Policies” in the
“Notes to Consolidated Financial Statements” for a description of BB&T’ s impairment testing process. Management
considers the sensitivity of the significant assumptions in its impairment analysis including consideration of a 10% change in
estimated future cash flows or the discount rate for each reporting unit.
Pension and Postretirement Benefit Obligations
BB&T offers various pension plans and postretirement benefit plans to employees. Calculation of the obligations and related
expenses under these plans requires the use of actuarial valuation methods and assumptions. Actuarial assumptions used in
the determination of future values of plan assets and liabilities are subject to management judgment and may differ
significantly if different assumptions are used. The discount rate assumption used to measure the postretirement benefit
obligations is set by reference to published high-quality bond indices, as well as certain hypothetical spot-rate yield curves.
These yield curves were constructed from the underlying bond price and yield data collected as of the plan’ s measurement
date and are represented by a series of annualized, individual discount rates with durations ranging from six months to thirty
years. Each discount rate in the curve was derived from an equal weighting of the double A or higher bond universe,
apportioned into distinct maturity groups. For durations where no bond maturities were available, the discount rates for these
maturities were extrapolated based on historical relationships from observable data in similar markets. These indices and
hypothetical curves give only an indication of the appropriate discount rate because the cash flows of the bonds comprising
the indices and curves do not match the projected benefit payment stream of the plan precisely. For this reason, BB&T also
considers the individual characteristics of the plan, such as projected cash flow patterns and payment durations, when setting
the discount rate. Management evaluated the sensitivity changes that the expected return on plan assets and the discount rate
would have on pension expense for 2013. A decrease of 25 basis points in the discount rate would result in additional
pension expense of approximately $19 million for 2013. Based on the balance of plan assets on December 31, 2012, a
decrease of one percent in the expected return on plan assets would result in an increase of approximately $30 million in
pension expense for 2013. Refer to Note 14 “Benefit Plans” in the “Notes to Consolidated Financial Statements” for
disclosures related to BB&T’ s benefit plans.
Income Taxes
The calculation of BB&T’ s income tax provision is complex and requires the use of estimates and judgments. As part of the
Company’ s analysis and implementation of business strategies, consideration is given to the tax laws and regulations that
apply to the specific facts and circumstances for any tax position under evaluation. For tax positions that are uncertain in
nature, management determines whether the tax position is more likely than not to be sustained upon examination. For tax
positions that meet this threshold, management then estimates the amount of the tax benefit to recognize in the financial
statements. Management closely monitors tax developments in order to evaluate the effect they may have on the Company’ s
overall tax position and the estimates and judgments used in determining the income tax provision and records adjustments as
necessary.
Analysis of Results of Operations
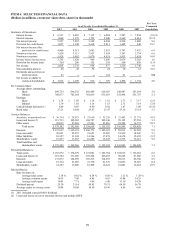
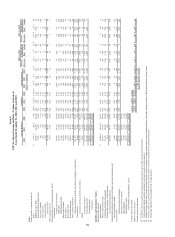
Consolidated net income available to common shareholders totaled $1.9 billion for 2012, which generated basic EPS of $2.74
and diluted EPS of $2.70. Net income available to common shareholders for 2011 and 2010 was $1.3 billion and $816
million, respectively. Basic EPS was $1.85 in 2011 and $1.18 in 2010, while diluted EPS was $1.83 and $1.16 for 2011 and
2010, respectively.
Two important and commonly used measures of bank profitability are return on average assets (net income as a percentage of
average total assets) and return on average common shareholders’ equity (net income available to common shareholders as a
percentage of average common shareholders’ equity). BB&T’ s returns on average assets were 1.14%, 0.82%, and 0.54% for
the years ended December 31, 2012, 2011 and 2010, respectively. The returns on average common shareholders’ equity were
10.35%, 7.49%, and 4.85% for the last three years.
Net Interest Income and NIM
Net interest income is BB&T’ s primary source of revenue. Net interest income is influenced by a number of factors,
including the volume, mix and maturity of interest-earning assets and interest-bearing liabilities and the interest rates earned
and paid thereon. The difference between rates earned on interest-earning assets and the cost of funds (with a FTE
adjustment made to tax-exempt items to provide comparability with taxable items) is measured by the NIM.