BB&T 2012 Annual Report Download - page 97
Download and view the complete annual report
Please find page 97 of the 2012 BB&T annual report below. You can navigate through the pages in the report by either clicking on the pages listed below, or by using the keyword search tool below to find specific information within the annual report.-
 1
1 -
2
-
3
-
4
-
5
-
6
-
7
-
8
-
9
-
10
-
11
-
12
-
13
-
14
-
15
-
16
-
17
-
18
-
19
-
20
-
21
-
22
-
23
-
24
-
25
-
26
-
27
-
28
-
29
-
30
-
31
-
32
-
33
-
34
-
35
-
36
-
37
-
38
-
39
-
40
-
41
-
42
-
43
-
44
-
45
-
46
-
47
-
48
-
49
-
50
-
51
-
52
-
53
-
54
-
55
-
56
-
57
-
58
-
59
-
60
-
61
-
62
-
63
-
64
-
65
-
66
-
67
-
68
-
69
-
70
-
71
-
72
-
73
-
74
-
75
-
76
-
77
-
78
-
79
-
80
-
81
-
82
-
83
-
84
-
85
-
86
-
 87
87 -
 88
88 -
 89
89 -
 90
90 -
 91
91 -
 92
92 -
 93
93 -
 94
94 -
 95
95 -
 96
96 -
 97
97 -
 98
98 -
 99
99 -
 100
100 -
 101
101 -
 102
102 -
 103
103 -
 104
104 -
 105
105 -
 106
106 -
 107
107 -
108
-
109
-
110
-
111
-
112
-
113
-
114
-
115
-
116
-
117
-
118
-
119
-
120
-
121
-
122
-
123
-
124
-
125
-
126
-
127
-
128
-
129
-
130
-
131
-
132
-
133
-
134
-
135
-
136
-
137
-
138
-
139
-
140
-
141
-
142
-
143
-
144
-
145
-
146
-
147
-
148
-
149
-
150
-
151
-
152
-
153
-
154
-
155
-
156
-
157
-
158
-
159
-
160
-
161
-
162
-
163
-
164
-
165
-
166
-
167
-
168
-
169
-
170
-
171
-
172
-
173
-
174
-
175
-
176
 |
 |

75
management’ s intent to maintain Branch Bank’ s capital at levels that result in regulatory risk-based capital ratios that are
generally comparable with peers of similar size, complexity and risk profile. If the capital levels of Branch Bank increase
above these guidelines, excess capital may be transferred to the Parent Company, subject to regulatory and other operating
considerations, in the form of special dividend payments.
While nonrecurring events or management decisions may result in the Company temporarily falling below its minimum
guidelines for one or more of these ratios, it is management’ s intent through capital planning to return to these targeted
minimums within a reasonable period of time. Such temporary decreases below these minimums are not considered an
infringement of BB&T’ s overall capital policy provided the Company and Branch Bank remain “well-capitalized.”
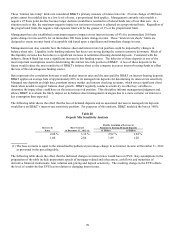
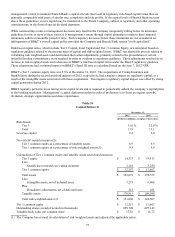
Risk-based capital ratios, which include Tier 1 Capital, Total Capital and Tier 1 Common Equity, are calculated based on
regulatory guidance related to the measurement of capital and risk-weighted assets. BB&T reevaluated its process related to
calculating risk-weighted assets and determined that certain adjustments, primarily related to the presentation of certain
unfunded lending commitments, were required in order to conform to regulatory guidance. These adjustments resulted in an
increase to risk-weighted assets and a decrease in BB&T’ s risk-based capital ratios under the Basel I regulatory guidance.
These adjustments had a minimal impact on BB&T’ s Basel III ratio as calculated based on the June 7, 2012 NPR.
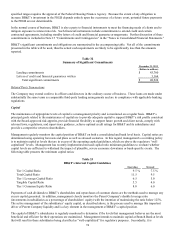
BB&T’ s Tier 1 common equity ratio was 9.3% at December 31, 2012. The acquisitions of Crump Insurance and
BankAtlantic during the second and third quarters of 2012, respectively, had a negative impact on regulatory capital, as a
result of the intangible assets associated with those acquisitions. This negative regulatory capital impact was offset by strong
capital generation during 2012.
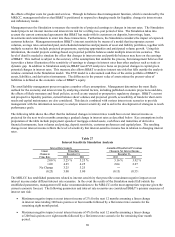
BB&T regularly performs stress testing on its capital levels and is required to periodically submit the company’ s capital plans
to the banking regulators. Management’ s capital deployment plan in order of preference is to focus on organic growth,
dividends, strategic opportunities and share repurchases.
Table 34
Capital Ratios (1)
December 31,
2012 2011
(Dollars in millions, except per share data)
Risk-based:
Tier 1 11.0 % 12.0 %
Total 13.9 15.1
Leverage capital 8.2 9.0
N
on-GAAP capital measures (2):
Tier 1 common equity as a percentage of tangible assets 6.9 6.9
Tier 1 common equity as a percentage of risk-weighted assets (3) 9.3 9.4
Calculations of Tier 1 common equity and tangible assets and related measures:
Tier 1 equity $ 14,373 $ 14,913
Less:
Qualifying restricted core capital elements 2,116 3,250
Tier 1 common equity $ 12,257 $ 11,663
Total assets $ 183,872 $ 174,579
Less:
Intangible assets, net of deferred taxes 7,273 6,406
Plus:
Regulatory adjustments, net of deferred taxes 212 421
Tangible assets $ 176,811 $ 168,594
Total risk-weighted assets (3) $ 131,096 $ 124,507
Tier 1 common equity $ 12,257 $ 11,663
Outstanding shares at end of period (in thousands) 699,728 697,143
Tangible book value per common share $ 17.52 $ 16.73
(1) The Company has revised its calculation of risk-weighted assets and adjusted the applicable ratios.