BB&T 2012 Annual Report Download - page 124
Download and view the complete annual report
Please find page 124 of the 2012 BB&T annual report below. You can navigate through the pages in the report by either clicking on the pages listed below, or by using the keyword search tool below to find specific information within the annual report.-
 1
1 -
2
-
3
-
4
-
5
-
6
-
7
-
8
-
9
-
10
-
11
-
12
-
13
-
14
-
15
-
16
-
17
-
18
-
19
-
20
-
21
-
22
-
23
-
24
-
25
-
26
-
27
-
28
-
29
-
30
-
31
-
32
-
33
-
34
-
35
-
36
-
37
-
38
-
39
-
40
-
41
-
42
-
43
-
44
-
45
-
46
-
47
-
48
-
49
-
50
-
51
-
52
-
53
-
54
-
55
-
56
-
57
-
58
-
59
-
60
-
61
-
62
-
63
-
64
-
65
-
66
-
67
-
68
-
69
-
70
-
71
-
72
-
73
-
74
-
75
-
76
-
77
-
78
-
79
-
80
-
81
-
82
-
83
-
84
-
85
-
86
-
87
-
88
-
89
-
90
-
91
-
92
-
93
-
94
-
95
-
96
-
97
-
98
-
99
-
100
-
101
-
102
-
103
-
104
-
105
-
106
-
107
-
108
-
109
-
110
-
111
-
112
-
113
-
 114
114 -
 115
115 -
 116
116 -
 117
117 -
 118
118 -
 119
119 -
 120
120 -
 121
121 -
 122
122 -
 123
123 -
 124
124 -
 125
125 -
 126
126 -
 127
127 -
 128
128 -
 129
129 -
 130
130 -
 131
131 -
 132
132 -
 133
133 -
 134
134 -
135
-
136
-
137
-
138
-
139
-
140
-
141
-
142
-
143
-
144
-
145
-
146
-
147
-
148
-
149
-
150
-
151
-
152
-
153
-
154
-
155
-
156
-
157
-
158
-
159
-
160
-
161
-
162
-
163
-
164
-
165
-
166
-
167
-
168
-
169
-
170
-
171
-
172
-
173
-
174
-
175
-
176
 |
 |

102
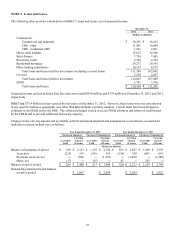
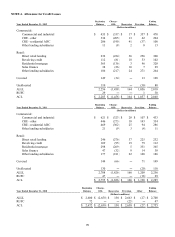
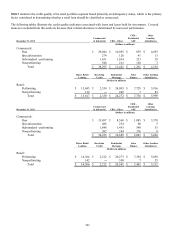
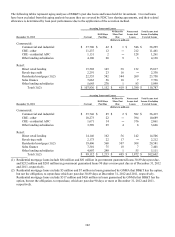
The following tables represent aging analyses of BB&T's past due loans and leases held for investment. Covered loans
have been excluded from this aging analysis because they are covered by FDIC loss sharing agreements, and their related
allowance is determined by loan pool performance due to the application of the accretion method.
Accruing Loans and Leases
90 Days Or Nonaccrual Total Loans And
30-89 Days More Past Loans And Leases, Excluding
December 31, 2012 Current Past Due Due Leases Covered Loans
(Dollars in millions)
Commercial:
Commercial and industrial $ 37,706 $ 42 $ 1 $ 546 $ 38,295
CRE - other 11,237 12 ― 212 11,461
CRE - residential ADC 1,131 2 ― 128 1,261
Other lending subsidiaries 4,106 20 9 3 4,138
Retail:
Direct retail lending 15,502 145 38 132 15,817
Revolving credit 2,291 23 16 ― 2,330
Residential mortgage (1)(2) 22,555 582 344 269 23,750
Sales finance 7,663 56 10 7 7,736
Other lending subsidiaries 5,645 270 1 83 5,999
Total (1)(2) $ 107,836 $ 1,152 $ 419 $ 1,380 $ 110,787
Accruing Loans and Leases
90 Days Or Nonaccrual Total Loans And
30-89 Days More Past Loans And Leases, Excluding
December 31, 2011 Current Past Due Due Leases Covered Loans
(Dollars in millions)
Commercial:
Commercial and industrial $ 35,746 $ 85 $ 2 $ 582 $ 36,415
CRE - other 10,273 22 ― 394 10,689
CRE - residential ADC 1,671 14 ― 376 2,061
Other lending subsidiaries 3,589 25 4 8 3,626
Retail:
Direct retail lending 14,146 162 56 142 14,506
Revolving credit 2,173 22 17 ― 2,212
Residential mortgage (1)(2) 19,406 560 307 308 20,581
Sales finance 7,301 75 18 7 7,401
Other lending subsidiaries 4,807 248 1 55 5,111
Total (1)(2) $ 99,112 $ 1,213 $ 405 $ 1,872 $ 102,602
(1) Residential mortgage loans include $84 million and $81 million in government guaranteed loans 30-89 days past due,
and $252 million and $203 million in government guaranteed loans 90 days or more past due as of December 31, 2012
and 2011, respectively.
(2) Residential mortgage loans exclude $5 million and $7 million in loans guaranteed by GNMA that BB&T has the option,
but not the obligation, to repurchase which are past due 30-89 days at December 31, 2012 and 2011, respectively.
Residential mortgage loans exclude $517 million and $426 million in loans guaranteed by GNMA that BB&T has the
option, but not the obligation, to repurchase, which are past due 90 days or more at December 31, 2012 and 2011,
respectively.