BB&T 2012 Annual Report Download - page 85
Download and view the complete annual report
Please find page 85 of the 2012 BB&T annual report below. You can navigate through the pages in the report by either clicking on the pages listed below, or by using the keyword search tool below to find specific information within the annual report.-
 1
1 -
2
-
3
-
4
-
5
-
6
-
7
-
8
-
9
-
10
-
11
-
12
-
13
-
14
-
15
-
16
-
17
-
18
-
19
-
20
-
21
-
22
-
23
-
24
-
25
-
26
-
27
-
28
-
29
-
30
-
31
-
32
-
33
-
34
-
35
-
36
-
37
-
38
-
39
-
40
-
41
-
42
-
43
-
44
-
45
-
46
-
47
-
48
-
49
-
50
-
51
-
52
-
53
-
54
-
55
-
56
-
57
-
58
-
59
-
60
-
61
-
62
-
63
-
64
-
65
-
66
-
67
-
68
-
69
-
70
-
71
-
72
-
73
-
74
-
 75
75 -
 76
76 -
 77
77 -
 78
78 -
 79
79 -
 80
80 -
 81
81 -
 82
82 -
 83
83 -
 84
84 -
 85
85 -
 86
86 -
 87
87 -
 88
88 -
 89
89 -
 90
90 -
 91
91 -
 92
92 -
 93
93 -
 94
94 -
 95
95 -
96
-
97
-
98
-
99
-
100
-
101
-
102
-
103
-
104
-
105
-
106
-
107
-
108
-
109
-
110
-
111
-
112
-
113
-
114
-
115
-
116
-
117
-
118
-
119
-
120
-
121
-
122
-
123
-
124
-
125
-
126
-
127
-
128
-
129
-
130
-
131
-
132
-
133
-
134
-
135
-
136
-
137
-
138
-
139
-
140
-
141
-
142
-
143
-
144
-
145
-
146
-
147
-
148
-
149
-
150
-
151
-
152
-
153
-
154
-
155
-
156
-
157
-
158
-
159
-
160
-
161
-
162
-
163
-
164
-
165
-
166
-
167
-
168
-
169
-
170
-
171
-
172
-
173
-
174
-
175
-
176
 |
 |

63
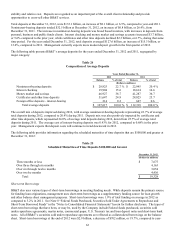
stability and relative cost. Deposits are regarded as an important part of the overall client relationship and provide
opportunities to cross-sell other BB&T services.
Total deposits at December 31, 2012, were $133.1 billion, an increase of $8.1 billion, or 6.5%, compared to year-end 2011.
Noninterest-bearing deposits totaled $32.5 billion at December 31, 2012, an increase of $6.8 billion, or 26.4%, from
December 31, 2011. The increase in noninterest-bearing deposits was broad based in nature, with increases in deposits from
personal, business and public funds clients. Interest checking and money market and savings accounts increased $3.7 billion,
or 5.6% compared to the prior year, while certificates and other time deposits declined $2.3 billion, or 6.7%, during that same
time period. For the year ended December 31, 2012, total deposits averaged $127.6 billion, an increase of $15.3 billion, or
13.6%, compared to 2011. Management currently expects more modest deposit growth in the first quarter of 2013.
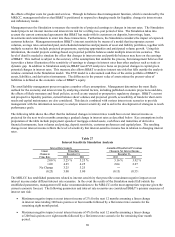
The following table presents BB&T’ s average deposits for the years ended December 31, 2012 and 2011, segregated by
major category:
Table 24
Composition of Average Deposits
Years Ended December 31,
2012 2011
Balance % of total Balance % of total
(Dollars in millions)
N
oninteres
t
-bearing deposits $ 28,925 22.7 % $ 22,945 20.4 %
Interest checking 19,904 15.6 18,614 16.6
Money market and savings 46,927 36.7 41,287 36.7
Certificates and other time deposits 31,647 24.8 28,825 25.7
Foreign office deposits - interest-bearing 214 0.2 647 0.6
Total average deposits $ 127,617 100.0 % $ 112,318 100.0 %
The overall mix of deposits improved during 2012, with average noninterest-bearing deposits representing 22.7% of average
total deposits during 2012, compared to 20.4% during 2011. Deposit mix was also positively impacted by certificates and
other time deposits, which represented 24.8% of average total deposits during 2012, down from 25.7% of average total
deposits during 2011. The average cost of interest-bearing deposits was 0.43% for 2012, compared to 0.68% in the prior
year. Management expects that deposit costs will continue to trend downward in 2013.
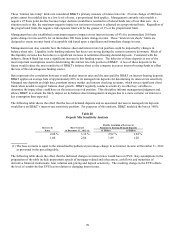
The following table provides information regarding the scheduled maturities of time deposits that are $100,000 and greater at
December 31, 2012:
Table 25
Scheduled Maturities of Time Deposits $100,000 and Greater
December 31, 2012
(Dollars in millions)
Three months or less $ 7,675
Over three through six months 4,163
Over six through twelve months 3,054
Over twelve months 4,436
Total $ 19,328
Short-term Borrowings
BB&T also uses various types of short-term borrowings in meeting funding needs. While deposits remain the primary source
for funding loan originations, management uses short-term borrowings as a supplementary funding source for loan growth
and other balance sheet management purposes. Short-term borrowings were 1.9% of total funding on average in 2012 as
compared to 3.2% in 2011. See Note 8 “Federal Funds Purchased, Securities Sold Under Agreements to Repurchase and
Short-Term Borrowed Funds” in the “Notes to Consolidated Financial Statements” herein for further disclosure. The types of
short-term borrowings that have been, or may be, used by the Company include Federal funds purchased, securities sold
under repurchase agreements, master notes, commercial paper, U.S. Treasury tax and loan deposit notes and short-term bank
notes. All of BB&T’ s securities sold under repurchase agreements are reflected as collateralized borrowings on the balance
sheet. Short-term borrowings at the end of 2012 were $2.9 billion, a decrease of $702 million, or 19.7%, compared to year-