BB&T 2012 Annual Report Download - page 147
Download and view the complete annual report
Please find page 147 of the 2012 BB&T annual report below. You can navigate through the pages in the report by either clicking on the pages listed below, or by using the keyword search tool below to find specific information within the annual report.-
 1
1 -
2
-
3
-
4
-
5
-
6
-
7
-
8
-
9
-
10
-
11
-
12
-
13
-
14
-
15
-
16
-
17
-
18
-
19
-
20
-
21
-
22
-
23
-
24
-
25
-
26
-
27
-
28
-
29
-
30
-
31
-
32
-
33
-
34
-
35
-
36
-
37
-
38
-
39
-
40
-
41
-
42
-
43
-
44
-
45
-
46
-
47
-
48
-
49
-
50
-
51
-
52
-
53
-
54
-
55
-
56
-
57
-
58
-
59
-
60
-
61
-
62
-
63
-
64
-
65
-
66
-
67
-
68
-
69
-
70
-
71
-
72
-
73
-
74
-
75
-
76
-
77
-
78
-
79
-
80
-
81
-
82
-
83
-
84
-
85
-
86
-
87
-
88
-
89
-
90
-
91
-
92
-
93
-
94
-
95
-
96
-
97
-
98
-
99
-
100
-
101
-
102
-
103
-
104
-
105
-
106
-
107
-
108
-
109
-
110
-
111
-
112
-
113
-
114
-
115
-
116
-
117
-
118
-
119
-
120
-
121
-
122
-
123
-
124
-
125
-
126
-
127
-
128
-
129
-
130
-
131
-
132
-
133
-
134
-
135
-
136
-
 137
137 -
 138
138 -
 139
139 -
 140
140 -
 141
141 -
 142
142 -
 143
143 -
 144
144 -
 145
145 -
 146
146 -
 147
147 -
 148
148 -
 149
149 -
 150
150 -
 151
151 -
 152
152 -
 153
153 -
 154
154 -
 155
155 -
 156
156 -
 157
157 -
158
-
159
-
160
-
161
-
162
-
163
-
164
-
165
-
166
-
167
-
168
-
169
-
170
-
171
-
172
-
173
-
174
-
175
-
176
 |
 |

125
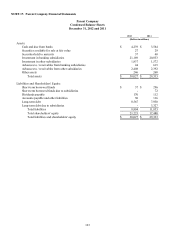
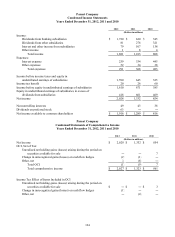
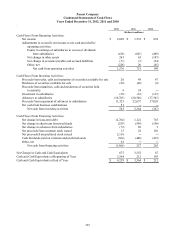
Parent Company
Condensed Statements of Cash Flows
Years Ended December 31, 2012, 2011 and 2010
.
2012 2011 2010
(Dollars in millions)
Cash Flows From Operating Activities:
N
et income $ 2,028 $ 1,332 $ 854
Adjustments to reconcile net income to net cash provided by
operating activities:
Equity in earnings of subsidiaries in excess of dividends
from subsidiaries (418) (661) (469)
N
et change in other assets 265 63 (147)
N
et change in accounts payable and accrued liabilities (71) (3) (24)
Other, net (228) 20 (65)
N
et cash from operating activities 1,576 751 149
Cash Flows From Investing Activities:
Proceeds from sales, calls and maturities of securities available for sale 26 49 87
Purchases of securities available for sale (26) (48) (8)
Proceeds from maturities, calls and paydowns of securities held
to maturity 4 24 ―
Investment in subsidiaries (30) (12) (113)
Advances to subsidiaries (10,785) (20,306) (37,341)
Proceeds from repayment of advances to subsidiaries 11,325 22,637 37,028
N
et cash from business combinations 51 ― ―
N
et cash from investing activities 565 2,344 (347)
Cash Flows From Financing Activities:
N
et change in long-term debt (2,764) 1,121 765
N
et change in shor
t
-term borrowed funds (259) (509) (198)
N
et change in advances from subsidiaries (72) 69 3
N
et proceeds from common stock issue
d
15 22 110
N
et proceeds from preferred stock issue
d
2,116 ― ―
Cash dividends paid on common and preferred stock (564) (446) (415)
Other, net 62 ― ―
N
et cash from financing activities (1,466) 257 265
N
et Change in Cash and Cash Equivalents 675 3,352 67
Cash and Cash Equivalents at Beginning of Year 3,564 212 145
Cash and Cash Equivalents at End of Year $ 4,239 $ 3,564 $ 212