BB&T 2012 Annual Report Download - page 74
Download and view the complete annual report
Please find page 74 of the 2012 BB&T annual report below. You can navigate through the pages in the report by either clicking on the pages listed below, or by using the keyword search tool below to find specific information within the annual report.-
 1
1 -
2
-
3
-
4
-
5
-
6
-
7
-
8
-
9
-
10
-
11
-
12
-
13
-
14
-
15
-
16
-
17
-
18
-
19
-
20
-
21
-
22
-
23
-
24
-
25
-
26
-
27
-
28
-
29
-
30
-
31
-
32
-
33
-
34
-
35
-
36
-
37
-
38
-
39
-
40
-
41
-
42
-
43
-
44
-
45
-
46
-
47
-
48
-
49
-
50
-
51
-
52
-
53
-
54
-
55
-
56
-
57
-
58
-
59
-
60
-
61
-
62
-
63
-
 64
64 -
 65
65 -
 66
66 -
 67
67 -
 68
68 -
 69
69 -
 70
70 -
 71
71 -
 72
72 -
 73
73 -
 74
74 -
 75
75 -
 76
76 -
 77
77 -
 78
78 -
 79
79 -
 80
80 -
 81
81 -
 82
82 -
 83
83 -
 84
84 -
85
-
86
-
87
-
88
-
89
-
90
-
91
-
92
-
93
-
94
-
95
-
96
-
97
-
98
-
99
-
100
-
101
-
102
-
103
-
104
-
105
-
106
-
107
-
108
-
109
-
110
-
111
-
112
-
113
-
114
-
115
-
116
-
117
-
118
-
119
-
120
-
121
-
122
-
123
-
124
-
125
-
126
-
127
-
128
-
129
-
130
-
131
-
132
-
133
-
134
-
135
-
136
-
137
-
138
-
139
-
140
-
141
-
142
-
143
-
144
-
145
-
146
-
147
-
148
-
149
-
150
-
151
-
152
-
153
-
154
-
155
-
156
-
157
-
158
-
159
-
160
-
161
-
162
-
163
-
164
-
165
-
166
-
167
-
168
-
169
-
170
-
171
-
172
-
173
-
174
-
175
-
176
 |
 |

52
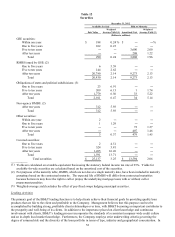
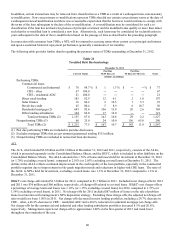
Table 12
Securities
December 31, 2012
Available for Sale Held to Maturity
Weighted Weighted
Fair Value Average Yield (1) Amortized Cost Average Yield (1)
(Dollars in millions)
GSE securities:
Within one year $ 188 0.24 % $ ― ―%
One to five years 102 0.23 ― ―
Five to ten years ― ― 3,600 2.00
After ten years ― ― 208 1.22
Total 290 0.24 3,808 1.96
RMBS issued by GSE: (2)
One to five years 6 5.59 ― ―
Five to ten years 144 2.62 ― ―
After ten years 20,780 2.14 9,273 2.13
Total 20,930 2.14 9,273 2.13
Obligations of states and political subdivisions: (3)
One to five years 23 6.91 ― ―
Five to ten years 209 6.15 1 1.74
After ten years 1,779 6.50 33 5.22
Total 2,011 6.47 34 5.14
N
on-agency RMBS: (2)
After ten years 312 5.93 ― ―
Total 312 5.93 ― ―
Other securities:
Within one year 2 ― ― ―
One to five years 1 1.29 ― ―
Five to ten years ― ― 72 1.37
After ten years ― ― 407 1.46
Total 3 0.37 479 1.45
Covered securities:
One to five years 2 4.51 ― ―
Five to ten years 324 3.81 ― ―
After ten years 1,265 16.26 ― ―
Total 1,591 13.71 ― ―
Total securities $ 25,137 3.25 $ 13,594 2.06
(1) Yields are calculated on a taxable-equivalent basis using the statutory federal income tax rate of 35%. Yields for
available-for-sale securities are calculated based on the amortized cost of the securities.
(2) For purposes of the maturity table, RMBS, which are not due at a single maturity date, have been included in maturity
groupings based on the contractual maturity. The expected life of RMBS will differ from contractual maturities
because borrowers may have the right to call or prepay the underlying mortgage loans with or without call or
prepayment penalties.
(3) Weighted-average yield excludes the effect of pay-fixed swaps hedging municipal securities.
Lending Activities
The primary goal of the BB&T lending function is to help clients achieve their financial goals by providing quality loan
products that are fair to the client and profitable to the Company. Management believes that this purpose can best be
accomplished by building strong, profitable client relationships over time, with BB&T becoming an important contributor to
the prosperity and well-being of its clients. In addition to the importance placed on client knowledge and continuous
involvement with clients, BB&T’ s lending process incorporates the standards of a consistent company-wide credit culture
and an in-depth local market knowledge. Furthermore, the Company employs strict underwriting criteria governing the
degree of assumed risk and the diversity of the loan portfolio in terms of type, industry and geographical concentration. In