BB&T 2012 Annual Report Download - page 130
Download and view the complete annual report
Please find page 130 of the 2012 BB&T annual report below. You can navigate through the pages in the report by either clicking on the pages listed below, or by using the keyword search tool below to find specific information within the annual report.-
 1
1 -
2
-
3
-
4
-
5
-
6
-
7
-
8
-
9
-
10
-
11
-
12
-
13
-
14
-
15
-
16
-
17
-
18
-
19
-
20
-
21
-
22
-
23
-
24
-
25
-
26
-
27
-
28
-
29
-
30
-
31
-
32
-
33
-
34
-
35
-
36
-
37
-
38
-
39
-
40
-
41
-
42
-
43
-
44
-
45
-
46
-
47
-
48
-
49
-
50
-
51
-
52
-
53
-
54
-
55
-
56
-
57
-
58
-
59
-
60
-
61
-
62
-
63
-
64
-
65
-
66
-
67
-
68
-
69
-
70
-
71
-
72
-
73
-
74
-
75
-
76
-
77
-
78
-
79
-
80
-
81
-
82
-
83
-
84
-
85
-
86
-
87
-
88
-
89
-
90
-
91
-
92
-
93
-
94
-
95
-
96
-
97
-
98
-
99
-
100
-
101
-
102
-
103
-
104
-
105
-
106
-
107
-
108
-
109
-
110
-
111
-
112
-
113
-
114
-
115
-
116
-
117
-
118
-
119
-
 120
120 -
 121
121 -
 122
122 -
 123
123 -
 124
124 -
 125
125 -
 126
126 -
 127
127 -
 128
128 -
 129
129 -
 130
130 -
 131
131 -
 132
132 -
 133
133 -
 134
134 -
 135
135 -
 136
136 -
 137
137 -
 138
138 -
 139
139 -
 140
140 -
141
-
142
-
143
-
144
-
145
-
146
-
147
-
148
-
149
-
150
-
151
-
152
-
153
-
154
-
155
-
156
-
157
-
158
-
159
-
160
-
161
-
162
-
163
-
164
-
165
-
166
-
167
-
168
-
169
-
170
-
171
-
172
-
173
-
174
-
175
-
176
 |
 |

108
As Of / For The
Years Ended December 31,
2012 2011
(Dollars in millions)
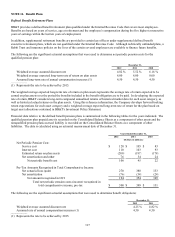
Unpaid principal balance of residential mortgage loans sold from the held for
sale portfolio $ 25,640 $ 17,202
Pre-tax gains recognized on mortgage loans sold and held for sale 539 175
Servicing fees recognized from mortgage loans serviced for others 247 240
Approximate weighted average servicing fee on the outstanding balance of
residential mortgage loans serviced for others 0.32 % 0.34 %
Weighted average coupon interest rate on mortgage loans serviced for others 4.59 5.02
The unpaid principal balances of BB&T’ s total residential mortgage loans serviced for others consist primarily of agency
conforming fixed-rate mortgage loans. Mortgage loans serviced for others are not included in loans and leases on the
accompanying Consolidated Balance Sheets.
During the years ended December 31, 2012 and 2011, BB&T sold residential mortgage loans from the held for sale portfolio
and recognized pre-tax gains including marking LHFS to fair value and the impact of interest rate lock commitments. These
gains are recorded in noninterest income as a component of mortgage banking income. BB&T retained the related MSRs and
receives servicing fees.
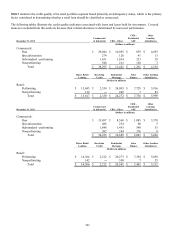
At December 31, 2012 and 2011, BB&T had residential mortgage loans sold with recourse liability. In the event of
nonperformance by the borrower, BB&T has recourse exposure for these loans. At both December 31, 2012 and 2011,
BB&T has recorded reserves related to these recourse exposures. Payments made to date have been immaterial.
BB&T also issues standard representations and warranties related to mortgage loan sales to GSEs. Although these
agreements often do not specify limitations, BB&T does not believe that any payments related to these warranties would
materially change the financial condition or results of operations of BB&T.
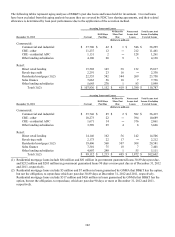
Residential MSRs are primarily recorded on the Consolidated Balance Sheets at fair value with changes in fair value recorded
as a component of mortgage banking income in the Consolidated Statements of Income for each period. BB&T uses various
derivative instruments to mitigate the income statement effect of changes in fair value due to changes in valuation inputs and
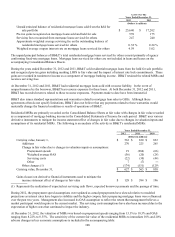
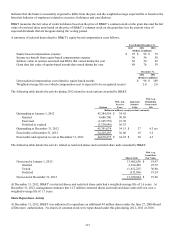
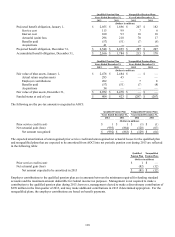
assumptions of its residential MSRs. The following is an analysis of the activity in BB&T’ s residential MSRs:
Years Ended December 31,
2012 2011 2010
(Dollars in millions)
Carrying value, January 1, $ 563 $ 830 $ 832
Additions 270 225 265
Change in fair value due to changes in valuation inputs or assumptions:
Prepayment speeds 19 (284) (66)
Weighted average OAS (36) (20) (28)
Servicing costs (22) (30) (44)
Other 7 (7) ―
Other changes (1) (174) (151) (129)
Carrying value, December 31, $ 627 $ 563 $ 830
Gains (losses) on derivative financial instruments used to mitigate the
income statement effect of changes in fair value $ 128 $ 394 $ 196
(1) Represents the realization of expected net servicing cash flows, expected borrower payments and the passage of time.
During 2012, the prepayment speed assumptions were updated as actual prepayments have slowed relative to modeled
projections as interest rates have begun to stabilize and the higher coupon, faster prepaying mortgage loans were refinanced
over the past two years. Management also increased its OAS assumption to reflect the return that management believes a
market participant would require in the current market. The servicing costs assumptions have also been increased due to the
expectation of higher costs that continued to impact the industry.
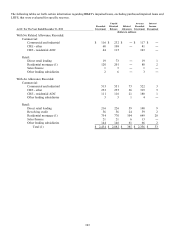
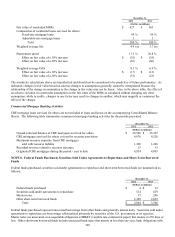
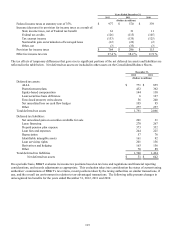
At December 31, 2012, the valuation of MSRs was based on prepayment speeds ranging from 15.3% to 18.5% and OAS
ranging from 8.22% to 8.35%. The sensitivity of the current fair value of the residential MSRs to immediate 10% and 20%
adverse changes in key economic assumptions is included in the accompanying table: