BB&T 2012 Annual Report Download - page 49
Download and view the complete annual report
Please find page 49 of the 2012 BB&T annual report below. You can navigate through the pages in the report by either clicking on the pages listed below, or by using the keyword search tool below to find specific information within the annual report.-
 1
1 -
2
-
3
-
4
-
5
-
6
-
7
-
8
-
9
-
10
-
11
-
12
-
13
-
14
-
15
-
16
-
17
-
18
-
19
-
20
-
21
-
22
-
23
-
24
-
25
-
26
-
27
-
28
-
29
-
30
-
31
-
32
-
33
-
34
-
35
-
36
-
37
-
38
-
 39
39 -
 40
40 -
 41
41 -
 42
42 -
 43
43 -
 44
44 -
 45
45 -
 46
46 -
 47
47 -
 48
48 -
 49
49 -
 50
50 -
 51
51 -
 52
52 -
 53
53 -
 54
54 -
 55
55 -
 56
56 -
 57
57 -
 58
58 -
 59
59 -
60
-
61
-
62
-
63
-
64
-
65
-
66
-
67
-
68
-
69
-
70
-
71
-
72
-
73
-
74
-
75
-
76
-
77
-
78
-
79
-
80
-
81
-
82
-
83
-
84
-
85
-
86
-
87
-
88
-
89
-
90
-
91
-
92
-
93
-
94
-
95
-
96
-
97
-
98
-
99
-
100
-
101
-
102
-
103
-
104
-
105
-
106
-
107
-
108
-
109
-
110
-
111
-
112
-
113
-
114
-
115
-
116
-
117
-
118
-
119
-
120
-
121
-
122
-
123
-
124
-
125
-
126
-
127
-
128
-
129
-
130
-
131
-
132
-
133
-
134
-
135
-
136
-
137
-
138
-
139
-
140
-
141
-
142
-
143
-
144
-
145
-
146
-
147
-
148
-
149
-
150
-
151
-
152
-
153
-
154
-
155
-
156
-
157
-
158
-
159
-
160
-
161
-
162
-
163
-
164
-
165
-
166
-
167
-
168
-
169
-
170
-
171
-
172
-
173
-
174
-
175
-
176
 |
 |

27
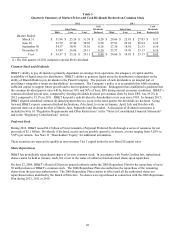
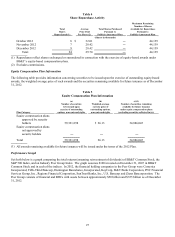
Table 4
Share Repurchase Activity
Maximum Remaining
Number of Shares
Total Average Total Shares Purchased Available for Repurchase
Shares Price Paid Pursuant to Pursuant to
Repurchased (1) Per Share (2) Publicly-Announced Plan Publicly-Announced Plan
(Shares in thousands)
October 2012 8 $ 32.01 ― 44,139
N
ovember 2012 7 28.42 ― 44,139
December 2012 9 28.42 ― 44,139
Total 24 29.70 ― 44,139
(1) Repurchases reflect shares exchanged or surrendered in connection with the exercise of equity-based awards under
BB&T’ s equity-based compensation plans.
(2) Excludes commissions.
Equity Compensation Plan Information
The following table provides information concerning securities to be issued upon the exercise of outstanding equity-based
awards, the weighted average price of such awards and the securities remaining available for future issuance as of December
31, 2012.
Table 5
Equity Compensation Plan Information
(a) (b) (c)(1)
Number of securities Weighted-average Number of securities remaining
to be issued upon exercise price of available for future issuance
exercise of outstanding outstanding options, under equity compensation plans
Plan Category options, warrants and rights warrants and rights (excluding securities reflected in (a))
Equity compensation plans
approved by security
holders 59,321,898 $ 26.13 34,886,045
Equity compensation plans
not approved by
security holders ― ― ―
Total 59,321,898 26.13 34,886,045
(1) All awards remaining available for future issuance will be issued under the terms of the 2012 Plan.
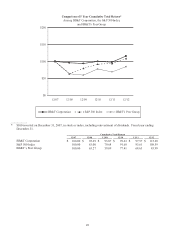
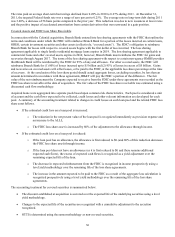
Performance Graph
Set forth below is a graph comparing the total returns (assuming reinvestment of dividends) of BB&T Common Stock, the
S&P 500 Index, and an Industry Peer Group Index. The graph assumes $100 invested on December 31, 2007 in BB&T
Common Stock and in each of the indices. In 2012, the financial holding companies in the Peer Group were Comerica
Incorporated, Fifth-Third Bancorp, Huntington Bancshares, Incorporated, KeyCorp, M&T Bank Corporation, PNC Financial
Services Group, Inc., Regions Financial Corporation, SunTrust Banks, Inc., U.S. Bancorp and Zions Bancorporation. The
Peer Group consists of financial and BHCs with assets between approximately $50 billion and $355 billion as of December
31, 2012.