BB&T 2012 Annual Report Download - page 93
Download and view the complete annual report
Please find page 93 of the 2012 BB&T annual report below. You can navigate through the pages in the report by either clicking on the pages listed below, or by using the keyword search tool below to find specific information within the annual report.-
 1
1 -
2
-
3
-
4
-
5
-
6
-
7
-
8
-
9
-
10
-
11
-
12
-
13
-
14
-
15
-
16
-
17
-
18
-
19
-
20
-
21
-
22
-
23
-
24
-
25
-
26
-
27
-
28
-
29
-
30
-
31
-
32
-
33
-
34
-
35
-
36
-
37
-
38
-
39
-
40
-
41
-
42
-
43
-
44
-
45
-
46
-
47
-
48
-
49
-
50
-
51
-
52
-
53
-
54
-
55
-
56
-
57
-
58
-
59
-
60
-
61
-
62
-
63
-
64
-
65
-
66
-
67
-
68
-
69
-
70
-
71
-
72
-
73
-
74
-
75
-
76
-
77
-
78
-
79
-
80
-
81
-
82
-
 83
83 -
 84
84 -
 85
85 -
 86
86 -
 87
87 -
 88
88 -
 89
89 -
 90
90 -
 91
91 -
 92
92 -
 93
93 -
 94
94 -
 95
95 -
 96
96 -
 97
97 -
 98
98 -
 99
99 -
 100
100 -
 101
101 -
 102
102 -
 103
103 -
104
-
105
-
106
-
107
-
108
-
109
-
110
-
111
-
112
-
113
-
114
-
115
-
116
-
117
-
118
-
119
-
120
-
121
-
122
-
123
-
124
-
125
-
126
-
127
-
128
-
129
-
130
-
131
-
132
-
133
-
134
-
135
-
136
-
137
-
138
-
139
-
140
-
141
-
142
-
143
-
144
-
145
-
146
-
147
-
148
-
149
-
150
-
151
-
152
-
153
-
154
-
155
-
156
-
157
-
158
-
159
-
160
-
161
-
162
-
163
-
164
-
165
-
166
-
167
-
168
-
169
-
170
-
171
-
172
-
173
-
174
-
175
-
176
 |
 |

71
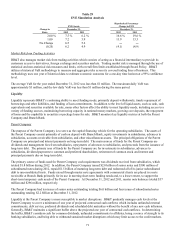
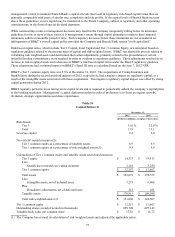
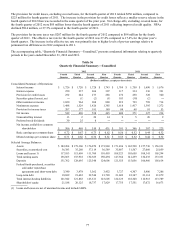
Table 29
EVE Simulation Analysis
Hypothetical Percentage
EVE/Assets Change in EVE
Change in December 31, December 31,
Rates 2012 2011 2012 2011
2.00 % 7.5 % 6.2 % 16.6 % 19.6 %
1.00 7.2 5.9 11.9 13.3
No Change 6.5 5.2 ― ―
(0.25) 6.2 4.9 (4.1) (4.9)
Market Risk from Trading Activities
BB&T also manages market risk from trading activities which consists of acting as a financial intermediary to provide its
customers access to derivatives, foreign exchange and securities markets. Trading market risk is managed through the use of
statistical and non-statistical risk measures and limits, with overall firm limits established through Board Policy. BB&T
utilizes a historical VaR methodology to measure and aggregate risks across its covered trading lines of business. This
methodology uses one year of historical data to estimate economic outcomes for a one-day time horizon at a 99% confidence
level.
The average VaR for the year ended December 31, 2012 was less than $1 million. The maximum daily VaR was
approximately $3 million, and the low daily VaR was less than $1 million during the same period.
Liquidity
Liquidity represents BB&T’ s continuing ability to meet funding needs, primarily deposit withdrawals, timely repayment of
borrowings and other liabilities, and funding of loan commitments. In addition to the level of liquid assets, such as cash, cash
equivalents and securities available for sale, many other factors affect the ability to meet liquidity needs, including access to a
variety of funding sources, maintaining borrowing capacity in national money markets, growing core deposits, the repayment
of loans and the capability to securitize or package loans for sale. BB&T monitors key liquidity metrics at both the Parent
Company and Branch Bank.
Parent Company
The purpose of the Parent Company is to serve as the capital financing vehicle for the operating subsidiaries. The assets of
the Parent Company consist primarily of cash on deposit with Branch Bank, equity investments in subsidiaries, advances to
subsidiaries, accounts receivable from subsidiaries, and other miscellaneous assets. The principal obligations of the Parent
Company are principal and interest payments on long-term debt. The main sources of funds for the Parent Company are
dividends and management fees from subsidiaries, repayments of advances to subsidiaries, and proceeds from the issuance of
long-term debt. The primary uses of funds by the Parent Company are for investments in subsidiaries, advances to
subsidiaries, dividend payments to common and preferred shareholders, retirement of common stock and interest and
principal payments due on long-term debt.
The primary source of funds used for Parent Company cash requirements was dividends received from subsidiaries, which
totaled $1.8 billion during 2012. In addition, the Parent Company issued $2.0 billion of senior notes and $300 million of
subordinated notes during 2012, repaid $1.5 billion of maturing long-term debt and redeemed all of its junior subordinated
debt to unconsolidated trusts. Funds raised through master note agreements with commercial clients are placed in a note
receivable at Branch Bank primarily for its use in meeting short-term funding needs and, to a lesser extent, to support the
short-term temporary cash needs of the Parent Company. At December 31, 2012 and 2011, master note balances totaled $37
million and $296 million, respectively.
The Parent Company had ten issues of senior notes outstanding totaling $6.0 billion and four issues of subordinated notes
outstanding totaling $2.2 billion at December 31, 2012.
Liquidity at the Parent Company is more susceptible to market disruptions. BB&T prudently manages cash levels at the
Parent Company to cover a minimum of one year of projected contractual cash outflows which includes unfunded external
commitments, debt service, preferred dividends and scheduled debt maturities without the benefit of any new cash infusions.
Generally, BB&T maintains a significant buffer above the projected one year of contractual cash outflows. In determining
the buffer, BB&T considers cash for common dividends, unfunded commitments to affiliates, being a source of strength to its
banking subsidiaries, and being able to withstand sustained market disruptions which may limit access to the credit markets.