BB&T 2012 Annual Report Download - page 119
Download and view the complete annual report
Please find page 119 of the 2012 BB&T annual report below. You can navigate through the pages in the report by either clicking on the pages listed below, or by using the keyword search tool below to find specific information within the annual report.-
 1
1 -
2
-
3
-
4
-
5
-
6
-
7
-
8
-
9
-
10
-
11
-
12
-
13
-
14
-
15
-
16
-
17
-
18
-
19
-
20
-
21
-
22
-
23
-
24
-
25
-
26
-
27
-
28
-
29
-
30
-
31
-
32
-
33
-
34
-
35
-
36
-
37
-
38
-
39
-
40
-
41
-
42
-
43
-
44
-
45
-
46
-
47
-
48
-
49
-
50
-
51
-
52
-
53
-
54
-
55
-
56
-
57
-
58
-
59
-
60
-
61
-
62
-
63
-
64
-
65
-
66
-
67
-
68
-
69
-
70
-
71
-
72
-
73
-
74
-
75
-
76
-
77
-
78
-
79
-
80
-
81
-
82
-
83
-
84
-
85
-
86
-
87
-
88
-
89
-
90
-
91
-
92
-
93
-
94
-
95
-
96
-
97
-
98
-
99
-
100
-
101
-
102
-
103
-
104
-
105
-
106
-
107
-
108
-
 109
109 -
 110
110 -
 111
111 -
 112
112 -
 113
113 -
 114
114 -
 115
115 -
 116
116 -
 117
117 -
 118
118 -
 119
119 -
 120
120 -
 121
121 -
 122
122 -
 123
123 -
 124
124 -
 125
125 -
 126
126 -
 127
127 -
 128
128 -
 129
129 -
130
-
131
-
132
-
133
-
134
-
135
-
136
-
137
-
138
-
139
-
140
-
141
-
142
-
143
-
144
-
145
-
146
-
147
-
148
-
149
-
150
-
151
-
152
-
153
-
154
-
155
-
156
-
157
-
158
-
159
-
160
-
161
-
162
-
163
-
164
-
165
-
166
-
167
-
168
-
169
-
170
-
171
-
172
-
173
-
174
-
175
-
176
 |
 |

97
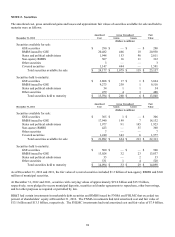
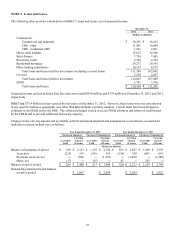
NOTE 3. Loans and Leases
The following table provides a breakdown of BB&T’ s loans and leases, net of unearned income:
December 31,
2012 2011
(Dollars in millions)
Commercial:
Commercial and industrial $ 38,295 $ 36,415
CRE - other 11,461 10,689
CRE - residential ADC 1,261 2,061
Direct retail lending 15,817 14,506
Sales finance 7,736 7,401
Revolving credit 2,330 2,212
Residential mortgage 24,272 20,581
Other lending subsidiaries 10,137 8,737
Total loans and leases held for investment (excluding covered loans) 111,309 102,602
Covered 3,294 4,867
Total loans and leases held for investment 114,603 107,469
LHFS 3,761 3,736
Total loans and leases $ 118,364 $ 111,205
Unearned income and net deferred loan fees and costs totaled $298 million and $374 million at December 31, 2012 and 2011,
respectively.
BB&T had $75.4 billion in loans secured by real estate at December 31, 2012. However, these loans were not concentrated
in any specific market or geographic area other than Branch Bank’ s primary markets. Certain loans have been pledged as
collateral to the FHLB and to the FRB. The collateral pledged is used to secure FHLB advances and letters of credit issued
by the FHLB and to provide additional borrowing capacity.
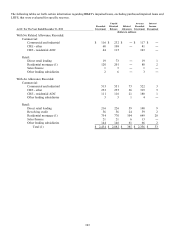
Changes in the carrying amount and accretable yield for purchased impaired and nonimpaired covered loans accounted for
under the accretion method were as follows:
Year Ended December 31, 2012 Year Ended December 31, 2011
Purchased Impaired Purchased Nonimpaired Purchased Impaired Purchased Nonimpaired
Carrying Carrying Carrying Carrying
Accretable Amount Accretable Amount Accretable Amount Accretable Amount
Yield of Loans Yield of Loans Yield of Loans Yield of Loans
(Dollars in millions)
Balance at beginning of period $ 520 $ 2,123 $ 1,193 $ 2,744 $ 833 $ 2,855 $ 1,549 $ 3,339
Accretion (219) 219 (541) 541 (358) 358 (691) 691
Payments received, net ― (942) ― (1,391) ― (1,090) ― (1,286)
Other, net (37) ― (35) ― 45 ― 335 ―
Balance at end of period $ 264 $ 1,400 $ 617 $ 1,894 $ 520 $ 2,123 $ 1,193 $ 2,744
Outstanding unpaid principal balance
at end of period $ 2,047 $ 2,489 $ 3,269 $ 3,825