BB&T 2012 Annual Report Download - page 61
Download and view the complete annual report
Please find page 61 of the 2012 BB&T annual report below. You can navigate through the pages in the report by either clicking on the pages listed below, or by using the keyword search tool below to find specific information within the annual report.-
 1
1 -
2
-
3
-
4
-
5
-
6
-
7
-
8
-
9
-
10
-
11
-
12
-
13
-
14
-
15
-
16
-
17
-
18
-
19
-
20
-
21
-
22
-
23
-
24
-
25
-
26
-
27
-
28
-
29
-
30
-
31
-
32
-
33
-
34
-
35
-
36
-
37
-
38
-
39
-
40
-
41
-
42
-
43
-
44
-
45
-
46
-
47
-
48
-
49
-
50
-
 51
51 -
 52
52 -
 53
53 -
 54
54 -
 55
55 -
 56
56 -
 57
57 -
 58
58 -
 59
59 -
 60
60 -
 61
61 -
 62
62 -
 63
63 -
 64
64 -
 65
65 -
 66
66 -
 67
67 -
 68
68 -
 69
69 -
 70
70 -
 71
71 -
72
-
73
-
74
-
75
-
76
-
77
-
78
-
79
-
80
-
81
-
82
-
83
-
84
-
85
-
86
-
87
-
88
-
89
-
90
-
91
-
92
-
93
-
94
-
95
-
96
-
97
-
98
-
99
-
100
-
101
-
102
-
103
-
104
-
105
-
106
-
107
-
108
-
109
-
110
-
111
-
112
-
113
-
114
-
115
-
116
-
117
-
118
-
119
-
120
-
121
-
122
-
123
-
124
-
125
-
126
-
127
-
128
-
129
-
130
-
131
-
132
-
133
-
134
-
135
-
136
-
137
-
138
-
139
-
140
-
141
-
142
-
143
-
144
-
145
-
146
-
147
-
148
-
149
-
150
-
151
-
152
-
153
-
154
-
155
-
156
-
157
-
158
-
159
-
160
-
161
-
162
-
163
-
164
-
165
-
166
-
167
-
168
-
169
-
170
-
171
-
172
-
173
-
174
-
175
-
176
 |
 |

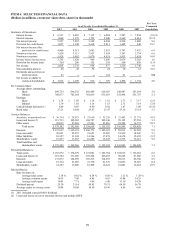
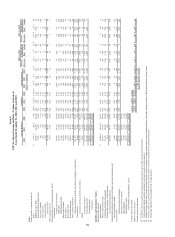
Table 8
FTE Net Interest Income and Rate / Volume Analysis (1)
Years Ended December 31, 2012, 2011 and 2010
2012 vs. 2011 2011 vs. 2010
Average Balances Yield/Rate Income/Expense Increase Change due to Increase Change due to
2012 2011 2010 2012 2011 2010 2012 2011 2010 (Decrease) Rate Volume (Decrease) Rate Volume
(Dollars in millions)
Assets
Total securities, at amortized cost: (2)
GSEs $ 1,601 $ 288 $ 568 1.64 % 1.52 % 3.67 % $ 26 $ 4 $ 21 $ 22 $ ―$ 22 $ (17) $ (9) $ (8)
RMBS issued by GSE 30,848 25,305 22,310 2.02 1.86 3.24 624 472 723 152 43 109 (251) (338) 87
States and political subdivisions 1,851 1,895 2,047 5.83 5.72 5.49 108 109 112 (1) 2 (3) (3) 5 (8)
N
on-agency RMBS 346 528 1,174 5.76 6.72 5.87 20 35 69 (15) (5) (10) (34) 9 (43)
Other securities 505 658 313 1.65 1.55 2.16 8 10 7 (2) 1 (3) 3 (2) 5
Covered securities 1,183 1,249 1,198 14.53 13.46 11.84 172 168 142 4 13 (9) 26 20 6
Total securities 36,334 29,923 27,610 2.64 2.67 3.89 958 798 1,074 160 54 106 (276) (315) 39
Other earning assets (3) 3,359 3,207 2,933 0.91 0.62 0.55 31 20 17 11 10 1 3 1 2
Loans and leases, net of unearned income: (4)(5)
Commercial:
Commercial and industrial 36,966 34,153 32,028 3.96 4.23 4.45 1,464 1,446 1,427 18 (96) 114 19 (72) 91
CRE-other 10,779 11,139 12,056 3.81 3.81 3.87 411 425 465 (14) ― (14) (40) (7) (33)
CRE-residential ADC 1,665 2,769 4,693 3.76 3.51 3.64 63 97 171 (34) 7 (41) (74) (6) (68)
Direct retail lending 15,270 13,850 14,033 4.87 5.22 5.36 744 722 751 22 (50) 72 (29) (19) (10)
Sales finance 7,680 7,202 6,766 3.97 4.88 5.87 305 352 397 (47) (69) 22 (45) (69) 24
Revolving credit 2,217 2,106 2,032 8.41 8.77 8.74 186 185 178 1 (8) 9 7 1 6
Residential mortgage 22,623 18,782 15,965 4.37 4.80 5.38 989 902 859 87 (86) 173 43 (99) 142
Other lending subsidiaries 9,525 8,280 7,778 11.04 11.51 11.46 1,051 953 892 98 (40) 138 61 4 57
Total loans and leases held for investment (excluding covered loans) 106,725 98,281 95,351 4.88 5.17 5.39 5,213 5,082 5,140 131 (342) 473 (58) (267) 209
Covered loans 4,045 5,498 7,059 18.91 19.15 13.22 765 1,053 933 (288) (13) (275) 120 357 (237)
Total loans and leases held for investment 110,770 103,779 102,410 5.40 5.91 5.93 5,978 6,135 6,073 (157) (355) 198 62 90 (28)
LHFS 2,963 2,183 2,377 3.42 3.75 3.80 101 82 90 19 (8) 27 (8) (1) (7)
Total loans and leases 113,733 105,962 104,787 5.35 5.87 5.88 6,079 6,217 6,163 (138) (363) 225 54 89 (35)
Total earning assets 153,426 139,092 135,330 4.61 5.06 5.36 7,068 7,035 7,254 33 (299) 332 (219) (225) 6
N
onearning assets 24,676 23,874 24,328
Total assets $ 178,102 $ 162,966 $ 159,658
Liabilities and Shareholders’ Equity
Interest-bearing deposits:
Interest-checking $ 19,904 $ 18,614 $ 16,477 0.12 0.16 0.17 25 30 29 (5) (7) 2 1 (2) 3
Money market and savings 46,927 41,287 34,942 0.18 0.31 0.50 85 129 175 (44) (60) 16 (46) (74) 28
Certificates and other time deposits 31,647 28,825 33,699 1.01 1.57 2.12 319 453 715 (134) (175) 41 (262) (168) (94)
Foreign office deposits - interest-bearing 214 647 1,913 0.11 (0.37) (0.11) ― (2) (2) 2 1 1 ― (2) 2
Total interest-bearing deposits 98,692 89,373 87,031 0.43 0.68 1.05 429 610 917 (181) (241) 60 (307) (246) (61)
Federal funds purchased, securities sold under repurchase agreements and
short-term borrowed funds 3,408 5,189 9,022 0.26 0.27 0.28 9 14 26 (5) (1) (4) (12) (1) (11)
Long-term debt 20,651 22,257 21,653 3.02 3.40 3.96 624 757 856 (133) (81) (52) (99) (122) 23
Total interest-bearing liabilities 122,751 116,819 117,706 0.86 1.18 1.53 1,062 1,381 1,799 (319) (323) 4 (418) (369) (49)
N
oninteres
t
-bearing deposits 28,925 22,945 19,742
Other liabilities 6,949 5,935 5,324
Shareholders’ equity 19,477 17,267 16,886
Total liabilities and shareholders’ equity $ 178,102 $ 162,966 $ 159,658
Average interest rate spread 3.75 % 3.88 % 3.83 %
N
IM/ net interest income 3.91 % 4.06 % 4.03 % $ 6,006 $ 5,654 $ 5,455 $ 352 $ 24 $ 328 $ 199 $ 144 $ 55
Taxable-equivalent adjustment $ 149 $ 147 $ 135
(1) Yields are stated on a taxable equivalent basis assuming tax rates in effect for the periods presented.
(2) Total securities include securities available for sale and securities held to maturity.
(3) Includes Federal funds sold, securities purchased under resale agreements or similar arrangements, interest-bearing deposits with banks, trading securities, FHLB stock and other earning assets.
(4) Loan fees, which are not material for any of the periods shown, have been included for rate calculation purposes.
(5)
N
onaccrual loans have been included in the average balances.
39