BB&T 2012 Annual Report Download - page 128
Download and view the complete annual report
Please find page 128 of the 2012 BB&T annual report below. You can navigate through the pages in the report by either clicking on the pages listed below, or by using the keyword search tool below to find specific information within the annual report.-
 1
1 -
2
-
3
-
4
-
5
-
6
-
7
-
8
-
9
-
10
-
11
-
12
-
13
-
14
-
15
-
16
-
17
-
18
-
19
-
20
-
21
-
22
-
23
-
24
-
25
-
26
-
27
-
28
-
29
-
30
-
31
-
32
-
33
-
34
-
35
-
36
-
37
-
38
-
39
-
40
-
41
-
42
-
43
-
44
-
45
-
46
-
47
-
48
-
49
-
50
-
51
-
52
-
53
-
54
-
55
-
56
-
57
-
58
-
59
-
60
-
61
-
62
-
63
-
64
-
65
-
66
-
67
-
68
-
69
-
70
-
71
-
72
-
73
-
74
-
75
-
76
-
77
-
78
-
79
-
80
-
81
-
82
-
83
-
84
-
85
-
86
-
87
-
88
-
89
-
90
-
91
-
92
-
93
-
94
-
95
-
96
-
97
-
98
-
99
-
100
-
101
-
102
-
103
-
104
-
105
-
106
-
107
-
108
-
109
-
110
-
111
-
112
-
113
-
114
-
115
-
116
-
117
-
 118
118 -
 119
119 -
 120
120 -
 121
121 -
 122
122 -
 123
123 -
 124
124 -
 125
125 -
 126
126 -
 127
127 -
 128
128 -
 129
129 -
 130
130 -
 131
131 -
 132
132 -
 133
133 -
 134
134 -
 135
135 -
 136
136 -
 137
137 -
 138
138 -
139
-
140
-
141
-
142
-
143
-
144
-
145
-
146
-
147
-
148
-
149
-
150
-
151
-
152
-
153
-
154
-
155
-
156
-
157
-
158
-
159
-
160
-
161
-
162
-
163
-
164
-
165
-
166
-
167
-
168
-
169
-
170
-
171
-
172
-
173
-
174
-
175
-
176
 |
 |

106
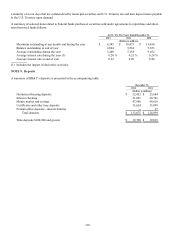
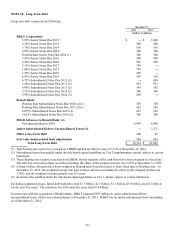
NOTE 5. Premises and Equipment
A summary of premises and equipment is presented in the accompanying table:
Estimated December 31,
Useful Life 2012 2011
(Years) (Dollars in millions)
Land and land improvements $ 547 $ 508
Buildings and building improvements 40 1,235 1,220
Furniture and equipment 5 - 10 1,141 1,132
Leasehold improvements 555 521
Construction in progress 37 37
Capitalized leases on premises and equipment 59 52
Total 3,574 3,470
Less - accumulated depreciation and amortization (1,686) (1,615)
N
et premises and equipmen
t
$ 1,888 $ 1,855
BB&T has noncancelable leases covering certain premises and equipment. Total rent expense applicable to operating leases
was $215 million, $199 million and $188 million for 2012, 2011 and 2010, respectively. Rental income from owned
properties and subleases was $8 million, $7 million and $8 million for 2012, 2011 and 2010, respectively. Future minimum
lease payments for operating leases for the five years subsequent to 2012 are $197 million, $181 million, $164 million, $147
million and $128 million. The payments for 2018 and later years total $613 million.
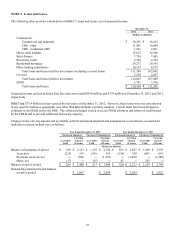
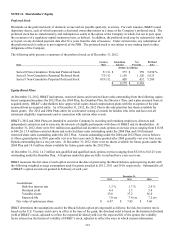
NOTE 6. Goodwill and Other Intangible Assets
The changes in the carrying amounts of goodwill attributable to each of BB&T’ s operating segments are reflected in the table
below. To date, there have been no goodwill impairments recorded by BB&T.
Residential Dealer
Community Mortgage Financial Specialized Insurance Financial
Banking Banking Services Lending Services Services Total
(Dollars in millions)
Balance, January 1, 2011 $ 4,537 $ 7 $ 111 $ 94 $ 1,067 $ 192 $ 6,008
Acquired goodwill, net ― ― ― ― 45 ― 45
Contingent consideration ― ― ― ― 20 ― 20
Other adjustments 5 ― ― ― ― ― 5
Balance, December 31, 2011 $ 4,542 $ 7 $ 111 $ 94 $ 1,132 $ 192 $ 6,078
Acquired goodwill, net 358 ― ― 5 358 ― 721
Contingent consideration ― ― ― ― 3 ― 3
Other adjustments ― ― ― ― 2 ― 2
Balance, December 31, 2012 $ 4,900 $ 7 $ 111 $ 99 $ 1,495 $ 192 $ 6,804
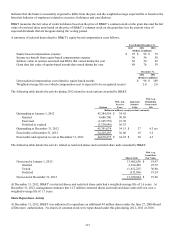
The following table presents the gross carrying amounts and accumulated amortization for BB&T’ s identifiable intangible
assets subject to amortization:
December 31, 2012 December 31, 2011
Gross Net Gross Net
Carrying Accumulated Carrying Carrying Accumulated Carrying
Amount Amortization Amount Amount Amortization Amount
(Dollars in millions)
Identifiable intangible assets:
CDI $ 672 $ (522) $ 150 $ 626 $ (484) $ 142
Other (1) 1,080 (557) 523 787 (485) 302
Totals $ 1,752 $ (1,079) $ 673 $ 1,413 $ (969) $ 444
(1) Other identifiable intangibles are primarily customer relationship intangibles.