BB&T 2012 Annual Report Download - page 82
Download and view the complete annual report
Please find page 82 of the 2012 BB&T annual report below. You can navigate through the pages in the report by either clicking on the pages listed below, or by using the keyword search tool below to find specific information within the annual report.-
 1
1 -
2
-
3
-
4
-
5
-
6
-
7
-
8
-
9
-
10
-
11
-
12
-
13
-
14
-
15
-
16
-
17
-
18
-
19
-
20
-
21
-
22
-
23
-
24
-
25
-
26
-
27
-
28
-
29
-
30
-
31
-
32
-
33
-
34
-
35
-
36
-
37
-
38
-
39
-
40
-
41
-
42
-
43
-
44
-
45
-
46
-
47
-
48
-
49
-
50
-
51
-
52
-
53
-
54
-
55
-
56
-
57
-
58
-
59
-
60
-
61
-
62
-
63
-
64
-
65
-
66
-
67
-
68
-
69
-
70
-
71
-
 72
72 -
 73
73 -
 74
74 -
 75
75 -
 76
76 -
 77
77 -
 78
78 -
 79
79 -
 80
80 -
 81
81 -
 82
82 -
 83
83 -
 84
84 -
 85
85 -
 86
86 -
 87
87 -
 88
88 -
 89
89 -
 90
90 -
 91
91 -
 92
92 -
93
-
94
-
95
-
96
-
97
-
98
-
99
-
100
-
101
-
102
-
103
-
104
-
105
-
106
-
107
-
108
-
109
-
110
-
111
-
112
-
113
-
114
-
115
-
116
-
117
-
118
-
119
-
120
-
121
-
122
-
123
-
124
-
125
-
126
-
127
-
128
-
129
-
130
-
131
-
132
-
133
-
134
-
135
-
136
-
137
-
138
-
139
-
140
-
141
-
142
-
143
-
144
-
145
-
146
-
147
-
148
-
149
-
150
-
151
-
152
-
153
-
154
-
155
-
156
-
157
-
158
-
159
-
160
-
161
-
162
-
163
-
164
-
165
-
166
-
167
-
168
-
169
-
170
-
171
-
172
-
173
-
174
-
175
-
176
 |
 |

60
In addition, certain transactions may be removed from classification as a TDR as a result of a subsequent non-concessionary
re-modification. Non-concessionary re-modifications represent TDRs that did not contain concessionary terms at the date of
a subsequent renewal/modification and there was a reasonable expectation that the borrower would continue to comply with
the terms of the loan subsequent to the date of the re-modification. A re-modification may be considered for such a re-
classification if the loan has not had a forgiveness of principal or interest and the modified terms qualify as more than minor
such that the re-modified loan is considered a new loan. Alternatively, such loans may be considered for reclassification in
years subsequent to the date of the re-modification based on the passage of time as described in the preceding paragraph.
In connection with consumer loan TDRs, a NPL will be returned to accruing status when current as to principal and interest
and upon a sustained historical repayment performance (generally a minimum of six months).
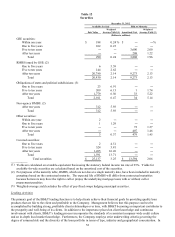
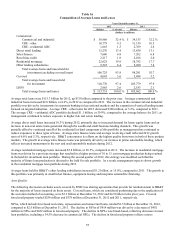
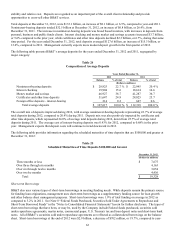
The following table provides further details regarding the payment status of TDRs outstanding at December 31, 2012:
Table 21
Troubled Debt Restructurings
December 31, 2012
Past Due Past Due
Current Status 30-89 Days (1) 90 Days Or More (1) Total
(Dollars in millions)
Performing TDRs:
Commercial loans:
Commercial and industrial $ 76 98.7 % $ 1 1.3 % $ ― ―% $ 77
CRE - other 67 100.0 ― ― ― ― 67
CRE - residential ADC 21 100.0 ― ― ― ― 21
Direct retail lending 183 92.9 12 6.1 2 1.0 197
Sales finance 16 84.2 2 10.5 1 5.3 19
Revolving credit 45 80.4 5 8.9 6 10.7 56
Residential mortgage (2) 643 83.6 106 13.8 20 2.6 769
Other lending subsidiaries 104 86.0 17 14.0 ― ― 121
Total performing TDRs (2) 1,155 87.0 143 10.8 29 2.2 1,327
N
onperforming TDRs (3) 60 25.0 24 10.0 156 65.0 240
Total TDRs (2) $ 1,215 77.5 $ 167 10.7 $ 185 11.8 $ 1,567
(1) Past due performing TDRs are included in past due disclosures.
(2) Excludes mortgage TDRs that are government guaranteed totaling $315 million.
(3) Nonperforming TDRs are included in nonaccrual loan disclosures.
ACL
The ACL, which totaled $2.0 billion and $2.3 billion at December 31, 2012 and 2011, respectively, consists of the ALLL,
which is presented separately on the Consolidated Balance Sheets, and the RUFC, which is included in other liabilities on the
Consolidated Balance Sheets. The ALLL amounted to 1.76% of loans and leases held for investment at December 31, 2012
(or 1.70% excluding covered loans), compared to 2.10% (or 2.05% excluding covered loans) at December 31, 2011. The
decline in the ALLL reflects continued improvement in the credit quality of the loan portfolio, especially in the commercial
portfolio segment due to improvement in risk-grade migration trends and reductions in higher-risk CRE loans. The ratio of
the ALLL to NPLs held for investment, excluding covered loans, was 1.37x at December 31, 2012 compared to 1.13x at
December 31, 2011.
BB&T’ s net charge-offs totaled $1.3 billion for 2012, compared to $1.7 billion in 2011. Included in net charge-offs for 2012
and 2011 was $34 million and $66 million, respectively, of charge-offs related to covered loans. BB&T’ s net charge-offs as
a percentage of average loans and leases was 1.14% (or 1.15% excluding covered loans) for 2012, compared to 1.57% (or
1.59% excluding covered loans), in 2011. Net charge-offs for 2011 included $87 million of losses on the sale of problem
loans in connection with management’ s NPA disposition strategy. Excluding these charge-offs, the adjusted net charge-off
ratio would have been 1.50% in 2011. Net charge-offs decreased in most lending portfolios, including a 24.7% decrease in
CRE – other, a 46.2% decrease in CRE – residential ADC and a 49.6% reduction in residential mortgage net charge-offs.
Net charge-offs for the commercial and industrial and other lending subsidiaries portfolios increased 8.5% and 20.6%,
respectively. Management expects net charge-offs to approximate 1.00% in the first quarter of 2013 and trend lower
throughout the remainder of the year.