BB&T 2012 Annual Report Download - page 65
Download and view the complete annual report
Please find page 65 of the 2012 BB&T annual report below. You can navigate through the pages in the report by either clicking on the pages listed below, or by using the keyword search tool below to find specific information within the annual report.-
 1
1 -
2
-
3
-
4
-
5
-
6
-
7
-
8
-
9
-
10
-
11
-
12
-
13
-
14
-
15
-
16
-
17
-
18
-
19
-
20
-
21
-
22
-
23
-
24
-
25
-
26
-
27
-
28
-
29
-
30
-
31
-
32
-
33
-
34
-
35
-
36
-
37
-
38
-
39
-
40
-
41
-
42
-
43
-
44
-
45
-
46
-
47
-
48
-
49
-
50
-
51
-
52
-
53
-
54
-
 55
55 -
 56
56 -
 57
57 -
 58
58 -
 59
59 -
 60
60 -
 61
61 -
 62
62 -
 63
63 -
 64
64 -
 65
65 -
 66
66 -
 67
67 -
 68
68 -
 69
69 -
 70
70 -
 71
71 -
 72
72 -
 73
73 -
 74
74 -
 75
75 -
76
-
77
-
78
-
79
-
80
-
81
-
82
-
83
-
84
-
85
-
86
-
87
-
88
-
89
-
90
-
91
-
92
-
93
-
94
-
95
-
96
-
97
-
98
-
99
-
100
-
101
-
102
-
103
-
104
-
105
-
106
-
107
-
108
-
109
-
110
-
111
-
112
-
113
-
114
-
115
-
116
-
117
-
118
-
119
-
120
-
121
-
122
-
123
-
124
-
125
-
126
-
127
-
128
-
129
-
130
-
131
-
132
-
133
-
134
-
135
-
136
-
137
-
138
-
139
-
140
-
141
-
142
-
143
-
144
-
145
-
146
-
147
-
148
-
149
-
150
-
151
-
152
-
153
-
154
-
155
-
156
-
157
-
158
-
159
-
160
-
161
-
162
-
163
-
164
-
165
-
166
-
167
-
168
-
169
-
170
-
171
-
172
-
173
-
174
-
175
-
176
 |
 |

43
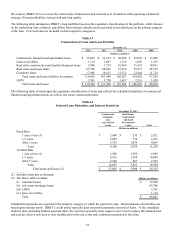
FDIC loss share income reflects the offset to the provision for covered loans, accretion of the FDIC receivable due to credit
loss improvement and accretion related to covered securities. During 2011 and 2010, covered loans experienced better
performance than originally anticipated resulting in additional interest income. A significant portion of the increases in
interest income for 2011 and 2010 was offset by reductions in noninterest income. For 2011 and 2010, noninterest income
was reduced by $297 million and $203 million, respectively, related to improvement in loan performance. These decreases
in income were partially offset by increases of $57 million and $115 million, respectively, which reflected 80% of the
provision for credit losses recorded on covered loans for 2011 and 2010.
BB&T recognized $62 million in net securities gains during 2011. The net securities gains during 2011 included $174
million of net gains realized from securities sales and $112 million of OTTI charges. The OTTI charges recognized during
2011 are due to weaker actual and forecasted collateral performance for non-agency RMBS. BB&T recognized $554 million
in net securities gains during 2010. The net securities gains recognized in 2010 included $585 million of net gains realized
from securities sales and $31 million of losses as a result of OTTI charges. The large decrease in securities gains during
2011 compared to 2010 reflects the results of the balance sheet deleveraging strategy that was executed during the second
quarter of 2010 and the de-risking of the investment portfolio that began during the third quarter of 2010 and was completed
in the fourth quarter. Refer to the “Analysis of Financial Condition – Investment Activities” section for a detailed discussion
of strategies executed during the years presented.
Other income decreased $60 million in 2011 compared to 2010, primarily due to losses and write-downs on commercial
loans that were transferred to the LHFS portfolio in 2010 in connection with management’ s NPL disposition strategy. There
was a total of $149 million of losses and write-downs recorded in 2011 compared to $90 million in 2010.
Noninterest Expense
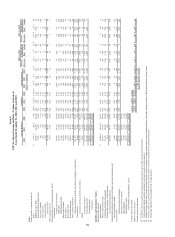
The following table provides a breakdown of BB&T’ s noninterest expense:
Table 10
Noninterest Expense
% Change
2012 2011
Years Ended December 31, v. v.
2012 2011 2010 2011 2010
(Dollars in millions)
Personnel expense $ 3,125 $ 2,727 $ 2,616 14.6 % 4.2 %
Occupancy and equipment expense 650 616 608 5.5 1.3
Loan-related expense 283 227 201 24.7 12.9
Foreclosed property expense 266 802 747 (66.8) 7.4
Regulatory charges 159 212 211 (25.0) 0.5
Professional services 156 174 170 (10.3) 2.4
Software expense 138 118 117 16.9 0.9
Amortization of intangibles 110 99 122 11.1 (18.9)
Merger-related and restructuring charges, net 68 16 69 NM (76.8)
Other expense 873 811 809 7.6 0.2
Total noninterest expense $ 5,828 $ 5,802 $ 5,670 0.4 2.3
2012 compared to 2011
Personnel expense is the largest component of noninterest expense and includes salaries, wages and incentives, as well as
pension and other employee benefit costs. Total personnel expense increased 14.6% during 2012, primarily the result of the
Crump Insurance and BankAtlantic acquisitions during 2012. Other factors contributing to this increase include normal
salary increases, higher production-related incentives and commissions and other performance incentives, and higher pension
expense related to certain changes in actuarial assumptions. Additional disclosures relating to BB&T’ s benefit plans can be
found in Note 14 “Benefit Plans” in the “Notes to Consolidated Financial Statements.”
Occupancy and equipment expense increased $34 million, or 5.5%, compared to 2011 primarily due to the acquisitions of
Crump Insurance and BankAtlantic.
Loan-related expense totaled $283 million, an increase of $56 million compared to the prior year. This increase was
primarily the result of higher investor-owned loan expense and provisions for higher mortgage repurchase reserves.