BB&T 2012 Annual Report Download - page 105
Download and view the complete annual report
Please find page 105 of the 2012 BB&T annual report below. You can navigate through the pages in the report by either clicking on the pages listed below, or by using the keyword search tool below to find specific information within the annual report.-
 1
1 -
2
-
3
-
4
-
5
-
6
-
7
-
8
-
9
-
10
-
11
-
12
-
13
-
14
-
15
-
16
-
17
-
18
-
19
-
20
-
21
-
22
-
23
-
24
-
25
-
26
-
27
-
28
-
29
-
30
-
31
-
32
-
33
-
34
-
35
-
36
-
37
-
38
-
39
-
40
-
41
-
42
-
43
-
44
-
45
-
46
-
47
-
48
-
49
-
50
-
51
-
52
-
53
-
54
-
55
-
56
-
57
-
58
-
59
-
60
-
61
-
62
-
63
-
64
-
65
-
66
-
67
-
68
-
69
-
70
-
71
-
72
-
73
-
74
-
75
-
76
-
77
-
78
-
79
-
80
-
81
-
82
-
83
-
84
-
85
-
86
-
87
-
88
-
89
-
90
-
91
-
92
-
93
-
94
-
 95
95 -
 96
96 -
 97
97 -
 98
98 -
 99
99 -
 100
100 -
 101
101 -
 102
102 -
 103
103 -
 104
104 -
 105
105 -
 106
106 -
 107
107 -
 108
108 -
 109
109 -
 110
110 -
 111
111 -
 112
112 -
 113
113 -
 114
114 -
 115
115 -
116
-
117
-
118
-
119
-
120
-
121
-
122
-
123
-
124
-
125
-
126
-
127
-
128
-
129
-
130
-
131
-
132
-
133
-
134
-
135
-
136
-
137
-
138
-
139
-
140
-
141
-
142
-
143
-
144
-
145
-
146
-
147
-
148
-
149
-
150
-
151
-
152
-
153
-
154
-
155
-
156
-
157
-
158
-
159
-
160
-
161
-
162
-
163
-
164
-
165
-
166
-
167
-
168
-
169
-
170
-
171
-
172
-
173
-
174
-
175
-
176
 |
 |

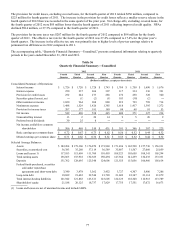
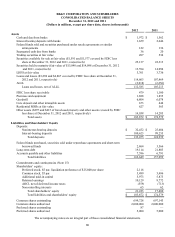
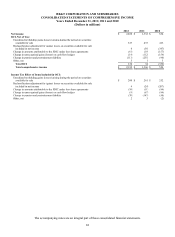
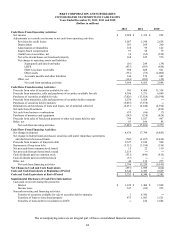
The accompanying notes are an integral part of these consolidated financial statements.
83
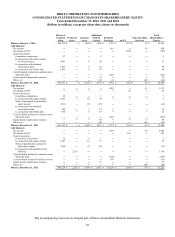
BB&T CORPORATION AND SUBSIDIARIES
CONSOLIDATED STATEMENTS OF CHANGES IN SHAREHOLDERS’ EQUITY
Years Ended December 31, 2012, 2011 and 2010
(Dollars in millions, except per share data, shares in thousands)
Shares of
Common
Stock
Preferred
Stock
Common
Stock
Additional
Paid-In
Capital
Retained
Earnings AOCI
Noncontrolling
Interests
Total
Shareholders'
Equity
Balance, January 1, 2010 689,750 $ ―$ 3,449 $ 5,620 $ 7,539 $ (417) $ 50 $ 16,241
Add (Deduct):
N
et income ― ― ― ― 816 ― 38 854
N
et change in OCI ― ― ― ― ― (330) ― (330)
Stock transactions:
In purchase acquisitions 57 ― ― 2 ― ― ― 2
In connection with equity awards,
net of repurchases 1,667 ― 8 24 ― ― ― 32
In connection with dividend
reinvestment plan 1,106 ― 6 24 ― ― ― 30
In connection with 401(k) plan 1,801 ― 9 39 ― ― ― 48
Cash dividends declared on common stock,
$0.60 per share ― ― ― ― (416) ― ― (416)
Equity-based compensation expense ― ― ― 79 ― ― ― 79
Other, net ― ― ― (12) (4) ― (26) (42)
Balance, December 31, 2010 694,381 $ ―$ 3,472 $ 5,776 $ 7,935 $ (747) $ 62 $ 16,498
Add (Deduct):
N
et income ― ― ― ― 1,289 ― 43 1,332
N
et change in OCI ― ― ― ― ― 34 ― 34
Stock transactions:
In purchase acquisitions 26 ― ― 1 ― ― ― 1
In connection with equity awards 1,963 ― 10 (9) ― ― ― 1
Shares repurchased in connection
equity awards (651) ― (3) (15) ― ― ― (18)
In connection with dividend
reinvestment plan 586 ― 3 13 ― ― ― 16
In connection with 401(k) plan 838 ― 4 19 ― ― ― 23
Cash dividends declared on common stock,
$0.65 per share ― ― ― ― (453) ― ― (453)
Equity-based compensation expense ― ― ― 98 ― ― ― 98
Other, net ― ― ― (10) 1 ― (43) (52)
Balance, December 31, 2011 697,143 $ ―$ 3,486 $ 5,873 $ 8,772 $ (713) $ 62 $ 17,480
Add (Deduct):
N
et income ― ― ― ― 1,979 ― 49 2,028
N
et change in OCI ― ― ― ― ― 154 ― 154
Stock transactions:
In purchase acquisitions 28 ― ― 1 ― ― ― 1
In connection with equity awards 3,147 ― 16 17 ― ― ― 33
Shares repurchased in connection
with equity awards (590) ― (3) (15) ― ― ― (18)
In connection with preferred stock
offerings ― 2,116 ― ― ― ― ― 2,116
Cash dividends declared on common stock,
$0.80 per share ― ― ― ― (559) ― ― (559)
Cash dividends declared on preferred stock ― ― ― ― (63) ― ― (63)
Equity-based compensation expense ― ― ― 97 ― ― ― 97
Other, net ― ― ― ― ― ― (46) (46)
Balance, December 31, 2012 699,728 $ 2,116 $ 3,499 $ 5,973 $ 10,129 $ (559) $ 65 $ 21,223