BB&T 2012 Annual Report Download - page 141
Download and view the complete annual report
Please find page 141 of the 2012 BB&T annual report below. You can navigate through the pages in the report by either clicking on the pages listed below, or by using the keyword search tool below to find specific information within the annual report.-
 1
1 -
2
-
3
-
4
-
5
-
6
-
7
-
8
-
9
-
10
-
11
-
12
-
13
-
14
-
15
-
16
-
17
-
18
-
19
-
20
-
21
-
22
-
23
-
24
-
25
-
26
-
27
-
28
-
29
-
30
-
31
-
32
-
33
-
34
-
35
-
36
-
37
-
38
-
39
-
40
-
41
-
42
-
43
-
44
-
45
-
46
-
47
-
48
-
49
-
50
-
51
-
52
-
53
-
54
-
55
-
56
-
57
-
58
-
59
-
60
-
61
-
62
-
63
-
64
-
65
-
66
-
67
-
68
-
69
-
70
-
71
-
72
-
73
-
74
-
75
-
76
-
77
-
78
-
79
-
80
-
81
-
82
-
83
-
84
-
85
-
86
-
87
-
88
-
89
-
90
-
91
-
92
-
93
-
94
-
95
-
96
-
97
-
98
-
99
-
100
-
101
-
102
-
103
-
104
-
105
-
106
-
107
-
108
-
109
-
110
-
111
-
112
-
113
-
114
-
115
-
116
-
117
-
118
-
119
-
120
-
121
-
122
-
123
-
124
-
125
-
126
-
127
-
128
-
129
-
130
-
 131
131 -
 132
132 -
 133
133 -
 134
134 -
 135
135 -
 136
136 -
 137
137 -
 138
138 -
 139
139 -
 140
140 -
 141
141 -
 142
142 -
 143
143 -
 144
144 -
 145
145 -
 146
146 -
 147
147 -
 148
148 -
 149
149 -
 150
150 -
 151
151 -
152
-
153
-
154
-
155
-
156
-
157
-
158
-
159
-
160
-
161
-
162
-
163
-
164
-
165
-
166
-
167
-
168
-
169
-
170
-
171
-
172
-
173
-
174
-
175
-
176
 |
 |

119
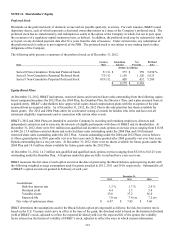
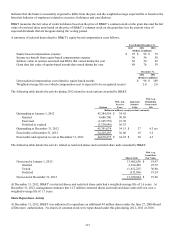
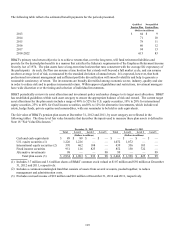
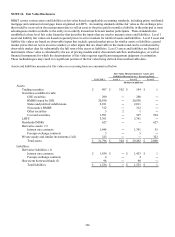
The following table reflects the estimated benefit payments for the periods presented.
Qualified Nonqualified
Pension Plan Pension Plans
(Dollars in millions)
2013 $ 64 $ 9
2014 71 10
2015 78 11
2016 86 12
2017 94 13
2018-2022 613 83
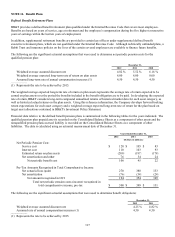
BB&T's primary total return objective is to achieve returns that, over the long term, will fund retirement liabilities and
provide for the desired plan benefits in a manner that satisfies the fiduciary requirements of the Employee Retirement Income
Security Act of 1974. The plan assets have a long-term time horizon that runs concurrent with the average life expectancy of
the participants. As such, the Plan can assume a time horizon that extends well beyond a full market cycle, and can assume
an above-average level of risk, as measured by the standard deviation of annual return. It is expected, however, that both
professional investment management and sufficient portfolio diversification will smooth volatility and help to generate a
reasonable consistency of return. The investments are broadly diversified among economic sector, industry, quality and size
in order to reduce risk and to produce incremental return. Within approved guidelines and restrictions, investment managers
have wide discretion over the timing and selection of individual investments.
BB&T periodically reviews its asset allocation and investment policy and makes changes to its target asset allocation. BB&T
has established guidelines within each asset category to ensure the appropriate balance of risk and reward. The current target
asset allocations for the plan assets include a range of 40% to 52% for U.S. equity securities, 10% to 20% for international
equity securities, 25% to 40% for fixed income securities, and 0% to 12% for alternative investments, which include real
estate, hedge funds, private equities and commodities, with any remainder to be held in cash equivalents.
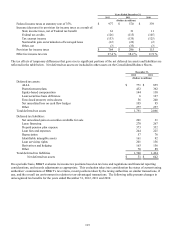
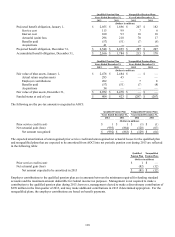
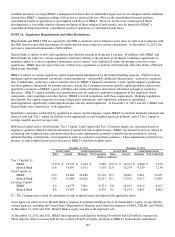
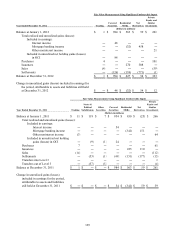
The fair value of BB&T's pension plan assets at December 31, 2012 and 2011, by asset category are reflected in the
following tables. The three level fair value hierarchy that describes the inputs used to measure these plan assets is defined in
Note 18 "Fair Value Disclosures.”
December 31, 2012 December 31, 2011
Total Level 1 Level 2 Level 3 Total Level 1 Level 2 Level 3
(Dollars in millions) (Dollars in millions)
Cash and cash-equivalents $ 89 $ 89 $ — $ — $ — $ — $ — $ —
U.S. equity securities (1) 1,226 1,226 — — 1,072 1,072 — —
International equity securities (2) 570 462 108 — 439 336 103 —
Fixed income securities 951 126 825 — 852 130 722 —
Alternative investments 98 — — 98 99 — — 99
Total plan assets (3) $ 2,934 $ 1,903 $ 933 $ 98 $ 2,462 $ 1,538 $ 825 $ 99
(1) Includes 3.7 million and 3.6 million shares of BB&T common stock valued at $107 million and $92 million at December
31, 2012 and 2011, respectively.
(2) Includes a common/commingled fund that consists of assets from several accounts, pooled together, to reduce
management and administration costs.
(3) Excludes accrued income of $18 million and $16 million at December 31, 2012 and 2011, respectively.