BB&T 2012 Annual Report Download - page 67
Download and view the complete annual report
Please find page 67 of the 2012 BB&T annual report below. You can navigate through the pages in the report by either clicking on the pages listed below, or by using the keyword search tool below to find specific information within the annual report.-
 1
1 -
2
-
3
-
4
-
5
-
6
-
7
-
8
-
9
-
10
-
11
-
12
-
13
-
14
-
15
-
16
-
17
-
18
-
19
-
20
-
21
-
22
-
23
-
24
-
25
-
26
-
27
-
28
-
29
-
30
-
31
-
32
-
33
-
34
-
35
-
36
-
37
-
38
-
39
-
40
-
41
-
42
-
43
-
44
-
45
-
46
-
47
-
48
-
49
-
50
-
51
-
52
-
53
-
54
-
55
-
56
-
 57
57 -
 58
58 -
 59
59 -
 60
60 -
 61
61 -
 62
62 -
 63
63 -
 64
64 -
 65
65 -
 66
66 -
 67
67 -
 68
68 -
 69
69 -
 70
70 -
 71
71 -
 72
72 -
 73
73 -
 74
74 -
 75
75 -
 76
76 -
 77
77 -
78
-
79
-
80
-
81
-
82
-
83
-
84
-
85
-
86
-
87
-
88
-
89
-
90
-
91
-
92
-
93
-
94
-
95
-
96
-
97
-
98
-
99
-
100
-
101
-
102
-
103
-
104
-
105
-
106
-
107
-
108
-
109
-
110
-
111
-
112
-
113
-
114
-
115
-
116
-
117
-
118
-
119
-
120
-
121
-
122
-
123
-
124
-
125
-
126
-
127
-
128
-
129
-
130
-
131
-
132
-
133
-
134
-
135
-
136
-
137
-
138
-
139
-
140
-
141
-
142
-
143
-
144
-
145
-
146
-
147
-
148
-
149
-
150
-
151
-
152
-
153
-
154
-
155
-
156
-
157
-
158
-
159
-
160
-
161
-
162
-
163
-
164
-
165
-
166
-
167
-
168
-
169
-
170
-
171
-
172
-
173
-
174
-
175
-
176
 |
 |

45
accruals are re-evaluated periodically and adjusted as necessary. The remaining accruals at December 31, 2012 are generally
expected to be utilized during 2013, unless they relate to specific contracts that expire in later years.
Provision for Income Taxes
BB&T’ s provision for income taxes totaled $764 million, $296 million and $115 million for 2012, 2011 and 2010,
respectively. BB&T’ s effective tax rates for the years ended 2012, 2011 and 2010 were 27.4%, 18.2% and 11.9%,
respectively. The increases in the effective tax rate for 2012 compared to 2011, and 2011 compared to 2010, reflect higher
levels of pre-tax earnings relative to permanent income tax differences.
BB&T has extended credit to and invested in the obligations of states and municipalities and their agencies, and has made
other investments and loans that produce tax-exempt income. The income generated from these investments, together with
certain other transactions that have favorable tax treatment, have reduced BB&T’ s overall effective tax rate from the statutory
rate in all periods presented.
Management currently expects the effective tax rate in the first quarter of 2013 to be similar to the effective tax rate in the
fourth quarter of 2012.
Refer to Note 13 “Income Taxes” in the “Notes to Consolidated Financial Statements” for a reconciliation of the effective tax
rate to the statutory tax rate and a discussion of uncertain tax positions and other tax matters.
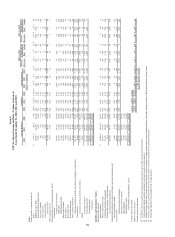
Segment Results
BB&T’ s operations are divided into six reportable business segments: Community Banking, Residential Mortgage Banking,
Dealer Financial Services, Specialized Lending, Insurance Services and Financial Services. These segments have been
identified based on BB&T’ s organizational structure. See Note 21 “Operating Segments” in the “Notes to Consolidated
Financial Statements” herein for additional disclosures related to BB&T’ s operating segments, the internal accounting and
reporting practices used to manage these segments and financial disclosures for these segments.
Fluctuations in noninterest income and noninterest expense incurred directly by the segments are more fully discussed in the
“Noninterest Income” and “Noninterest Expense” sections above.
2012 compared to 2011
Community Banking
Community Banking had a network of 1,832 banking offices at the end of 2012, an increase of 53 offices compared to
December 31, 2011. The increase in offices was driven by the BankAtlantic acquisition and de novo branch openings,
partially offset by the closing of low volume branches. Community Banking results include BankAtlantic since the systems
conversion in October 2012. Community Banking net income was $752 million in 2012, up $216 million, or 40.3%,
compared to 2011.
Segment net interest income for Community Banking totaled $3.4 billion in 2012 compared to $3.6 billion in 2011. The
decrease in segment net interest income was primarily attributable to lower funding credits on deposits as the result of
declining interest rates. This decrease was partially offset by loan growth and improvement in the deposit mix, which was
the result of an increase in noninterest-bearing deposits and a decrease in client CDs.
The allocated provision for loan and lease losses increased by $77 million, or 13.1%, to $666 million in 2012, primarily due
to loan growth and reserve rate adjustments, partially offset by lower charge-offs.
Noninterest income in Community Banking increased $109 million, or 10.7%, to $1.1 billion in 2012, primarily due to higher
bankcard and merchant fees, as well as losses on commercial LHFS in the prior year. The increase in noninterest income was
partially offset by lower debit interchange and overdraft fees. Noninterest income allocated from other segments, which is
reported as intersegment net referral fees (“referral fees”), increased by $50 million, or 37.9% in 2012, driven by higher
referrals for residential mortgage lending as originations grew.
Noninterest expense incurred by Community Banking during 2012 declined $526 million, or 22.3%, to $1.8 billion. This
decline was primarily due to lower foreclosed property expense and regulatory charges, partially offset by higher net
occupancy expense and personnel expense. Allocated corporate expense increased $126 million, or 14.0%, to $1.0 billion in
2012, primarily due to increases in loan administration, operations and marketing expense.