BB&T 2012 Annual Report Download - page 92
Download and view the complete annual report
Please find page 92 of the 2012 BB&T annual report below. You can navigate through the pages in the report by either clicking on the pages listed below, or by using the keyword search tool below to find specific information within the annual report.-
 1
1 -
2
-
3
-
4
-
5
-
6
-
7
-
8
-
9
-
10
-
11
-
12
-
13
-
14
-
15
-
16
-
17
-
18
-
19
-
20
-
21
-
22
-
23
-
24
-
25
-
26
-
27
-
28
-
29
-
30
-
31
-
32
-
33
-
34
-
35
-
36
-
37
-
38
-
39
-
40
-
41
-
42
-
43
-
44
-
45
-
46
-
47
-
48
-
49
-
50
-
51
-
52
-
53
-
54
-
55
-
56
-
57
-
58
-
59
-
60
-
61
-
62
-
63
-
64
-
65
-
66
-
67
-
68
-
69
-
70
-
71
-
72
-
73
-
74
-
75
-
76
-
77
-
78
-
79
-
80
-
81
-
 82
82 -
 83
83 -
 84
84 -
 85
85 -
 86
86 -
 87
87 -
 88
88 -
 89
89 -
 90
90 -
 91
91 -
 92
92 -
 93
93 -
 94
94 -
 95
95 -
 96
96 -
 97
97 -
 98
98 -
 99
99 -
 100
100 -
 101
101 -
 102
102 -
103
-
104
-
105
-
106
-
107
-
108
-
109
-
110
-
111
-
112
-
113
-
114
-
115
-
116
-
117
-
118
-
119
-
120
-
121
-
122
-
123
-
124
-
125
-
126
-
127
-
128
-
129
-
130
-
131
-
132
-
133
-
134
-
135
-
136
-
137
-
138
-
139
-
140
-
141
-
142
-
143
-
144
-
145
-
146
-
147
-
148
-
149
-
150
-
151
-
152
-
153
-
154
-
155
-
156
-
157
-
158
-
159
-
160
-
161
-
162
-
163
-
164
-
165
-
166
-
167
-
168
-
169
-
170
-
171
-
172
-
173
-
174
-
175
-
176
 |
 |

70
These “interest rate ramp” limits are considered BB&T’ s primary measure of interest rate risk. If a rate change of 200 basis
points cannot be modeled due to a low level of rates, a proportional limit applies. Management currently only models a
negative 25 basis point decline because larger declines would have resulted in a Federal funds rate of less than zero. In a
situation such as this, the maximum negative impact on net interest income is adjusted on a proportional basis. Regardless of
the proportional limit, the negative risk exposure limit will be the greater of 1% or the proportional limit.
Management has also established a maximum negative impact on net interest income of 4% for an immediate 100 basis
points change in rates and 8% for an immediate 200 basis points change in rates. These “interest rate shock” limits are
designed to create an outer band of acceptable risk based upon a significant and immediate change in rates.
Management must also consider how the balance sheet and interest rate risk position could be impacted by changes in
balance sheet mix. Liquidity in the banking industry has been very strong during the current economic downturn. Much of
this liquidity increase has been due to a significant increase in noninterest-bearing demand deposits. Consistent with the
industry, Branch Bank has seen a significant increase in this funding source. The behavior of these deposits is one of the
most important assumptions used in determining the interest rate risk position of BB&T. A loss of these deposits in the
future would reduce the asset sensitivity of BB&T’ s balance sheet as the company increases interest-bearing funds to offset
the loss of this advantageous funding source.
Beta represents the correlation between overall market interest rates and the rates paid by BB&T on interest-bearing deposits.
BB&T applies an average beta of approximately 80% to its managed rate deposits for determining its interest rate sensitivity.
Managed rate deposits are high beta, premium money market and interest checking accounts, which attract significant client
funds when needed to support balance sheet growth. BB&T regularly conducts sensitivity on other key variables to
determine the impact they could have on the interest rate risk position. This discipline informs management judgment and
allows BB&T to evaluate the likely impact on its balance sheet management strategies due to a more extreme variation in a
key assumption than expected.
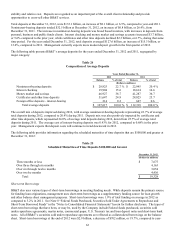
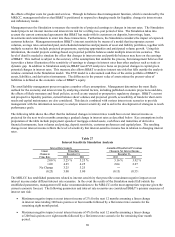
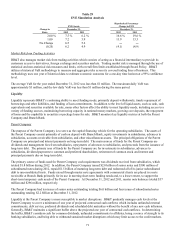
The following table shows the effect that the loss of demand deposits and an associated increase in managed rate deposits
would have on BB&T’ s interest-rate sensitivity position. For purposes of this analysis, BB&T modeled the beta at 100%.
Table 28
Deposit Mix Sensitivity Analysis
Results Assuming a Decrease in
Increase in Base Scenario Noninterest Bearing Demand Deposits
Rates at December 31, 2012 (1) $1 Billion $5 Billion
2.00 % 3.16 % 2.92 % 1.94 %
1.00 2.04 1.89 1.28
(1) The base scenario is equal to the annualized hypothetical percentage change in net interest income at December 31, 2012
as presented in the preceding table.
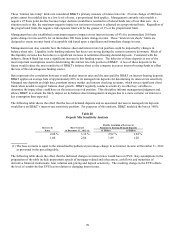
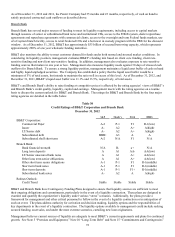
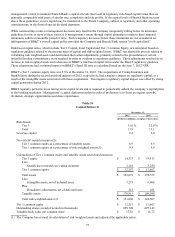
The following table shows the effect that the indicated changes in interest rates would have on EVE. Key assumptions in the
preparation of the table include prepayment speeds of mortgage-related and other assets, cash flows and maturities of
derivative financial instruments, loan volumes and pricing and deposit sensitivity. The resulting change in the EVE reflects
the level of sensitivity that EVE has in relation to changing interest rates.