BB&T 2012 Annual Report Download - page 70
Download and view the complete annual report
Please find page 70 of the 2012 BB&T annual report below. You can navigate through the pages in the report by either clicking on the pages listed below, or by using the keyword search tool below to find specific information within the annual report.-
 1
1 -
2
-
3
-
4
-
5
-
6
-
7
-
8
-
9
-
10
-
11
-
12
-
13
-
14
-
15
-
16
-
17
-
18
-
19
-
20
-
21
-
22
-
23
-
24
-
25
-
26
-
27
-
28
-
29
-
30
-
31
-
32
-
33
-
34
-
35
-
36
-
37
-
38
-
39
-
40
-
41
-
42
-
43
-
44
-
45
-
46
-
47
-
48
-
49
-
50
-
51
-
52
-
53
-
54
-
55
-
56
-
57
-
58
-
59
-
 60
60 -
 61
61 -
 62
62 -
 63
63 -
 64
64 -
 65
65 -
 66
66 -
 67
67 -
 68
68 -
 69
69 -
 70
70 -
 71
71 -
 72
72 -
 73
73 -
 74
74 -
 75
75 -
 76
76 -
 77
77 -
 78
78 -
 79
79 -
 80
80 -
81
-
82
-
83
-
84
-
85
-
86
-
87
-
88
-
89
-
90
-
91
-
92
-
93
-
94
-
95
-
96
-
97
-
98
-
99
-
100
-
101
-
102
-
103
-
104
-
105
-
106
-
107
-
108
-
109
-
110
-
111
-
112
-
113
-
114
-
115
-
116
-
117
-
118
-
119
-
120
-
121
-
122
-
123
-
124
-
125
-
126
-
127
-
128
-
129
-
130
-
131
-
132
-
133
-
134
-
135
-
136
-
137
-
138
-
139
-
140
-
141
-
142
-
143
-
144
-
145
-
146
-
147
-
148
-
149
-
150
-
151
-
152
-
153
-
154
-
155
-
156
-
157
-
158
-
159
-
160
-
161
-
162
-
163
-
164
-
165
-
166
-
167
-
168
-
169
-
170
-
171
-
172
-
173
-
174
-
175
-
176
 |
 |

48
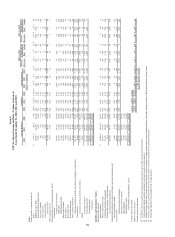
Segment net interest income for Community Banking totaled $3.6 billion in 2011 compared to $3.8 billion in 2010. The
decline in segment net interest income was primarily the effect of a lower interest rate environment. The decline in segment
net interest income was primarily attributable to lower funding credits on deposits as the result of declining interest rates,
This decline was partially offset by improvements in the deposit mix, as the result of growth in noninterest checking balances
and a decrease in client CD balances.
The allocated provision for loan and lease losses declined $1.2 billion, or 67.3%, to $589 million in 2011, reflecting lower
charge-offs in the CRE loan portfolios associated with improved credit quality metrics and charge-offs associated with the
accelerated disposition of commercial NPLs during 2011.
Noninterest income in Community Banking decreased $184 million, or 15.3%, to $1.0 billion in 2011, primarily due to
higher losses on commercial NPLs held for sale, lower overdraft fees and lower debit interchange fees. This decline in
noninterest income was offset by increases in merchant discounts, deposit account service charges, account analysis fees and
credit card interchange fees. Noninterest income allocated from other segments, which is reported as intersegment net
referral fees (“referral fees”), declined by $14 million, or 9.6% in 2011, This decline was driven by lower referrals for
residential mortgage lending as originations slowed.
Noninterest expense for Community Banking declined $19 million in 2011, or 0.8%, to $2.4 billion compared to 2010. The
decline was primarily due to lower regulatory charges and personnel expense, partially offset by higher foreclosed property
expense. Allocated corporate expense increased $100 million, or 12.5%, to $899 million in 2011, primarily due to increases
in loan administration expense, IT services and operations.
Residential Mortgage Banking
BB&T’ s mortgage originations totaled $23.7 billion in 2011, down $1.2 billion, or 4.8%, compared to 2010. BB&T’ s
residential mortgage servicing portfolio, which includes both retained loans and loans serviced for third parties, totaled $91.6
billion at year end 2011, an increase of 9.8%, compared to $83.5 billion at December 31, 2010. Residential Mortgage
Banking experienced a net loss of $15 million in 2011, compared to a net loss of $77 million in 2010.
Segment net interest income for Residential Mortgage Banking totaled $291 million in 2011, up $31 million, or 11.9%,
compared to 2010. The increase in segment net interest income in 2011 was primarily due to growth in the loans held for
investment, as well as higher spreads compared to funding costs.
The allocated provision for loan and lease losses was $320 million for 2011, down $233 million, or 42.1%, compared to $553
million in 2010. The decline in provision expense reflects improved credit quality in the loan portfolio. Net charge-offs of
$87 million and $141 million were recorded in 2011 and 2010, respectively, impacted by the sale of problem loans in
connection with management’ s NPL disposition strategy.
Noninterest income in Residential Mortgage Banking declined $108 million, or 23.6%, to $349 million in 2011. This
decrease was due to lower volumes and margins on loans originated for sale. Noninterest expense increased $42 million, or
16.5%, to $296 million compared to 2010, reflecting higher foreclosed property expense, as well as increased provision
expense associated with loan repurchases.
Dealer Financial Services
Net income from Dealer Financial Services was $209 million in 2011, up $24 million, or 13.0%, over 2010.
Segment net interest income for Dealer Financial Services increased by $68 million, or 13.2%, to $582 million in 2011
compared to 2010. The increase in segment net interest income was primarily due to growth in the prime auto and marine
and recreational vehicle loan portfolios, as well as an improved NIM in Regional Acceptance Corporation’ s point-of-sale
loan portfolio.
The allocated provision for loan and lease losses of $125 million was up $32 million, or 34.4%, in 2011, primarily due to
increases in Regional Acceptance Corporation’ s allowance for loan losses related to nonprime auto loans as delinquent
accounts and NPAs move from historical lows to more normalized levels.
Specialized Lending
Specialized Lending continued to expand during 2011 through strong organic growth. Net income was $235 million for
2011, up $67 million, or 39.9%, compared to 2010.