BB&T 2012 Annual Report Download - page 9
Download and view the complete annual report
Please find page 9 of the 2012 BB&T annual report below. You can navigate through the pages in the report by either clicking on the pages listed below, or by using the keyword search tool below to find specific information within the annual report.-
 1
1 -
 2
2 -
 3
3 -
 4
4 -
 5
5 -
 6
6 -
 7
7 -
 8
8 -
 9
9 -
 10
10 -
 11
11 -
 12
12 -
 13
13 -
 14
14 -
 15
15 -
 16
16 -
 17
17 -
 18
18 -
 19
19 -
 20
20 -
21
-
22
-
23
-
24
-
25
-
26
-
27
-
28
-
29
-
30
-
31
-
32
-
33
-
34
-
35
-
36
-
37
-
38
-
39
-
40
-
41
-
42
-
43
-
44
-
45
-
46
-
47
-
48
-
49
-
50
-
51
-
52
-
53
-
54
-
55
-
56
-
57
-
58
-
59
-
60
-
61
-
62
-
63
-
64
-
65
-
66
-
67
-
68
-
69
-
70
-
71
-
72
-
73
-
74
-
75
-
76
-
77
-
78
-
79
-
80
-
81
-
82
-
83
-
84
-
85
-
86
-
87
-
88
-
89
-
90
-
91
-
92
-
93
-
94
-
95
-
96
-
97
-
98
-
99
-
100
-
101
-
102
-
103
-
104
-
105
-
106
-
107
-
108
-
109
-
110
-
111
-
112
-
113
-
114
-
115
-
116
-
117
-
118
-
119
-
120
-
121
-
122
-
123
-
124
-
125
-
126
-
127
-
128
-
129
-
130
-
131
-
132
-
133
-
134
-
135
-
136
-
137
-
138
-
139
-
140
-
141
-
142
-
143
-
144
-
145
-
146
-
147
-
148
-
149
-
150
-
151
-
152
-
153
-
154
-
155
-
156
-
157
-
158
-
159
-
160
-
161
-
162
-
163
-
164
-
165
-
166
-
167
-
168
-
169
-
170
-
171
-
172
-
173
-
174
-
175
-
176
 |
 |
2012 Annual Report
7
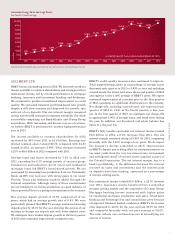
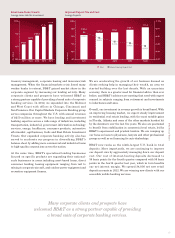
We held noninterest expenses basically flat at $5.8 billion
in 2012. Increases in production-related incentives and
commissions were offset in part by decreases in foreclosed
property expenses, which were at the lowest level since the third
quarter of 2007. For the first quarter of 2013, we expect lower
noninterest expenses, driven by decreases in production-related
incentives and professional services, with essentially flat
discretionary spending and full-time equivalent employment.
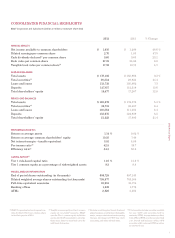
BB&T’s return on average assets improved to 1.14% in 2012
from 0.82% in 2011, while return on average common
shareholders’ equity increased to 10.4% from 7.5%. Both
measures are superior to our peer average. We also continue to
outperform our peers in pre-tax, pre-credit earnings, which we
believe is an important measure of a bank’s consistent long-term
earnings power. Over the last 15 years, the compound annual
growth rate of BB&T’s pre-tax, pre-credit earnings is 13.3%.
Overall, we believe our 2012 results reflect the excellent progress
BB&T has made with our diversification strategy over the last
several years as we work to return to normalized profitability.
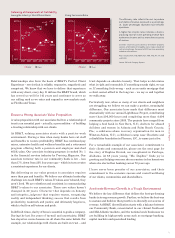
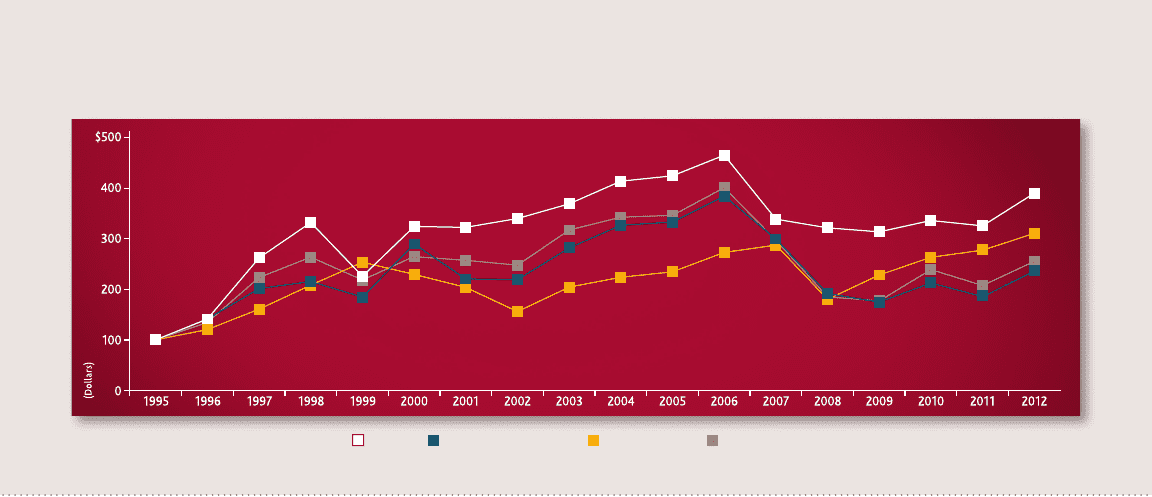
OUR STOCK PERFORMANCE
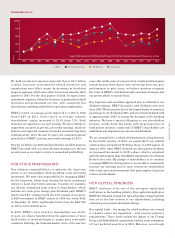
Our ultimate responsibility is to optimize the long-term
return to our shareholders, while providing a safe and sound
investment. We meet that responsibility by managing BB&T
for the long-term, rather than chasing the latest investment
vehicle to boost short-term earnings. Consider, for example,
our 20-year annualized total return to shareholders, which
includes net stock price change plus dividends paid. BB&T’s
return was 9.2%, compared with the 5.4% average of our peers.
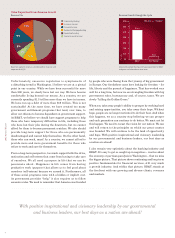
A $100 investment in BB&T shares in 1995 was worth $392
on December 31, 2012, significantly better than the S&P 500
as well as our in-market peers.
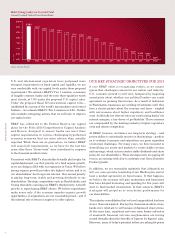
In 2012, BB&T’s total return to shareholders was 18.4%.
In part, our shares benefited from the appreciation of most
bank stocks as investors began to assign more reasonable
valuations following the financial-market crisis of the last five
years. But unlike some of our peers that realized outsized gains
mainly because their shares were recovering from very poor
performances in prior years, we believe investors recognize
the value of BB&T’s well-defined and consistent strategies and
our proven ability to execute them.
Our long-term and consistent approach also is reflected in our
dividend strategy. BB&T has paid a cash dividend every year
since 1903. We became the first of the largest banks to announce
an increase in our dividend in 2011, and our current dividend yield
of approximately 3.00% is among the strongest in the banking
industry. We have a special obligation to our shareholders
because, unlike many big banks with large majorities of
institutional investors, nearly half of BB&T’s shareholders are
individuals who depend on our returns and dividends.
We are committed to a robust dividend payout going forward.
In the fourth quarter of 2012, we earned $0.71 per diluted
common share and paid out $0.20 per share, or a 28% payout. In
January 2013, when BB&T declared our first quarter dividend,
we increased the amount to $0.23 a share, which is consistent
with the 2012 capital plan that BB&T submitted to the Federal
Reserve last year. My pledge to shareholders is to continue
to manage BB&T for the long term so we are able to consistently
increase our earnings and, in turn, reward our shareholders
with a safe and sound investment that pays superior long-term
returns and dividends.
OUR CAPITAL STRENGTH
BB&T continues to be one of the strongest capitalized
institutions in the banking industry. Our capital strength gives
BB&T the financial strength to take advantage of opportunities
that are in the best interest of our shareholders, including
continuing our proactive dividend strategy.
Our capital levels – the margin by which creditors are covered
if a bank’s assets are liquidated – well exceed regulatory
requirements. Those levels include the impact of our Crump
Group and BankAtlantic acquisitions and the early redemption
of trust preferred securities in 2012. Moreover, even though
Shareholder Return
BB&T S&P Commercial Banks S&P 500 Index Peer Average
Depicts $100 invested at 12/31/95 and held through 12/31/12 with dividends reinvested in the security or index.