BB&T 2012 Annual Report Download - page 3
Download and view the complete annual report
Please find page 3 of the 2012 BB&T annual report below. You can navigate through the pages in the report by either clicking on the pages listed below, or by using the keyword search tool below to find specific information within the annual report.-
 1
1 -
 2
2 -
 3
3 -
 4
4 -
 5
5 -
 6
6 -
 7
7 -
 8
8 -
 9
9 -
 10
10 -
 11
11 -
 12
12 -
 13
13 -
 14
14 -
15
-
16
-
17
-
18
-
19
-
20
-
21
-
22
-
23
-
24
-
25
-
26
-
27
-
28
-
29
-
30
-
31
-
32
-
33
-
34
-
35
-
36
-
37
-
38
-
39
-
40
-
41
-
42
-
43
-
44
-
45
-
46
-
47
-
48
-
49
-
50
-
51
-
52
-
53
-
54
-
55
-
56
-
57
-
58
-
59
-
60
-
61
-
62
-
63
-
64
-
65
-
66
-
67
-
68
-
69
-
70
-
71
-
72
-
73
-
74
-
75
-
76
-
77
-
78
-
79
-
80
-
81
-
82
-
83
-
84
-
85
-
86
-
87
-
88
-
89
-
90
-
91
-
92
-
93
-
94
-
95
-
96
-
97
-
98
-
99
-
100
-
101
-
102
-
103
-
104
-
105
-
106
-
107
-
108
-
109
-
110
-
111
-
112
-
113
-
114
-
115
-
116
-
117
-
118
-
119
-
120
-
121
-
122
-
123
-
124
-
125
-
126
-
127
-
128
-
129
-
130
-
131
-
132
-
133
-
134
-
135
-
136
-
137
-
138
-
139
-
140
-
141
-
142
-
143
-
144
-
145
-
146
-
147
-
148
-
149
-
150
-
151
-
152
-
153
-
154
-
155
-
156
-
157
-
158
-
159
-
160
-
161
-
162
-
163
-
164
-
165
-
166
-
167
-
168
-
169
-
170
-
171
-
172
-
173
-
174
-
175
-
176
 |
 |

2012 Annual Report
1
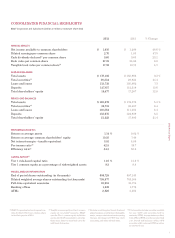
CONSOLIDATED FINANCIAL HIGHLIGHTS
BB&T Corporation and Subsidiaries (Dollars in millions, except per share data)
(1)
BB&T Corporation declared a special one-
time dividend of $0.01 per common share
in the first quarter of 2011.
(2)
Tangible common equity and tier 1 common
equity are non-GAAP measures. BB&T
uses the Tier 1 common equity definition
used in the SCAP assessment to calculate
these ratios. Refer to inside back cover for
additional disclosures.
(3)
Excludes securities gains (losses), foreclosed
property expense, amortization of intangible
assets, merger-related and restructuring
charges, the impact of FDIC loss share
accounting, and other selected items.
(4)
Total securities includes securities available
for sale (AFS) and securities held to
maturity (HTM). Average balances reflect
both AFS and HTM securities at amortized
cost. Period-end balances reflect AFS
securities at fair value and HTM securities
at amortized cost.
2012 2011 % Change
ANNUAL RESULTS
Net income available to common shareholders $ 1,916 $ 1,289 48.6 %
Diluted earnings per common share 2.70 1.83 47.5
Cash dividends declared(1) per common share 0.80 0.65 23.1
Book value per common share 27.21 24.98 8.9
Tangible book value per common share(2) 17.52 16.73 4.7
AVERAGE BALANCES
Total assets $ 178,102 $ 162,966 9.3 %
Total securities(4) 36,334 29,923 21.4
Loans and leases 113,733 105,962 7.3
Deposits 127,617 112,318 13.6
Total shareholders’ equity 19,477 17,267 12.8
PERIOD-END BALANCES
Total assets $ 183,872 $ 174,579 5.3 %
Total securities(4) 38,731 36,407 6.4
Loans and leases 118,364 111,205 6.4
Deposits 133,075 124,939 6.5
Total shareholders’ equity 21,223 17,480 21.4
PERFORMANCE RATIOS
Return on average assets 1.14 % 0.82 %
Return on average common shareholders’ equity 10.35 7.49
Net interest margin – taxable equivalent 3.91 4.06
Fee income ratio(3) 42.5 39.7
Efficiency ratio(3) 54.3 55.2
CAPITAL RATIOS(2)
Tier 1 risk-based capital ratio 11.0 % 12.0 %
Tier 1 common equity as a percentage of risk-weighted assets 9.3 9.4
MISCELLANEOUS INFORMATION
End of period shares outstanding (in thousands) 699,728 697,143
Diluted weighted average shares outstanding (in thousands) 708,877 705,168
Full-time equivalent associates 33,981 31,774
Banking offices 1,832 1,779
ATMs 2,826 2,483