BB&T 2012 Annual Report Download - page 120
Download and view the complete annual report
Please find page 120 of the 2012 BB&T annual report below. You can navigate through the pages in the report by either clicking on the pages listed below, or by using the keyword search tool below to find specific information within the annual report.-
 1
1 -
2
-
3
-
4
-
5
-
6
-
7
-
8
-
9
-
10
-
11
-
12
-
13
-
14
-
15
-
16
-
17
-
18
-
19
-
20
-
21
-
22
-
23
-
24
-
25
-
26
-
27
-
28
-
29
-
30
-
31
-
32
-
33
-
34
-
35
-
36
-
37
-
38
-
39
-
40
-
41
-
42
-
43
-
44
-
45
-
46
-
47
-
48
-
49
-
50
-
51
-
52
-
53
-
54
-
55
-
56
-
57
-
58
-
59
-
60
-
61
-
62
-
63
-
64
-
65
-
66
-
67
-
68
-
69
-
70
-
71
-
72
-
73
-
74
-
75
-
76
-
77
-
78
-
79
-
80
-
81
-
82
-
83
-
84
-
85
-
86
-
87
-
88
-
89
-
90
-
91
-
92
-
93
-
94
-
95
-
96
-
97
-
98
-
99
-
100
-
101
-
102
-
103
-
104
-
105
-
106
-
107
-
108
-
109
-
 110
110 -
 111
111 -
 112
112 -
 113
113 -
 114
114 -
 115
115 -
 116
116 -
 117
117 -
 118
118 -
 119
119 -
 120
120 -
 121
121 -
 122
122 -
 123
123 -
 124
124 -
 125
125 -
 126
126 -
 127
127 -
 128
128 -
 129
129 -
 130
130 -
131
-
132
-
133
-
134
-
135
-
136
-
137
-
138
-
139
-
140
-
141
-
142
-
143
-
144
-
145
-
146
-
147
-
148
-
149
-
150
-
151
-
152
-
153
-
154
-
155
-
156
-
157
-
158
-
159
-
160
-
161
-
162
-
163
-
164
-
165
-
166
-
167
-
168
-
169
-
170
-
171
-
172
-
173
-
174
-
175
-
176
 |
 |

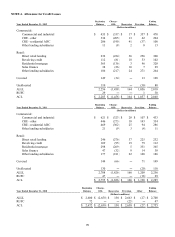
98
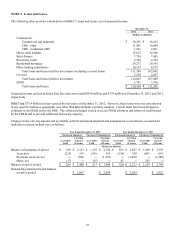
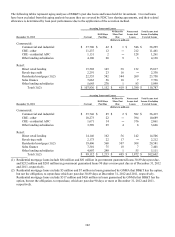
The following table provides a summary of TDRs that continue to accrue interest and TDRs that have been placed in
nonaccrual status:
December 31,
2012 2011
(Dollars in millions)
Performing TDRs:
Commercial:
Commercial and industrial $ 77 $ 74
CRE - other 67 117
CRE - residential ADC 21 44
Direct retail lending 197 146
Sales finance 19 8
Revolving credit 56 62
Residential mortgage (1)(2) 769 608
Other lending subsidiaries 121 50
Total performing TDRs (1)(2) 1,327 1,109
N
onperforming TDRs (3) 240 280
Total TDRs (1)(2)(3)(4) $ 1,567 $ 1,389
(1) Excludes mortgage TDRs held for investment that are government guaranteed totaling $313 million and $232 million at
December 31, 2012 and 2011, respectively.
(2) Excludes mortgage TDRs held for sale that are government guaranteed totaling $2 million and $4 million at December
31, 2012 and 2011, respectively.
(3)
N
onperforming TDRs are included in NPL disclosures.
(4) All TDRs are considered impaired. The ALLL attributable to these TDRs, excluding TDRs that are government
guaranteed, totaled $281 million and $266 million at December 31, 2012 and 2011, respectively.
Commitments to lend additional funds to clients with loans classified as TDRs were immaterial at December 31, 2012 and
2011. The gross additional interest income that would have been earned if the loans and leases classified as nonaccrual had
performed in accordance with the original terms was approximately $70 million, $93 million and $131 million in 2012, 2011
and 2010, respectively. The gross additional interest income that would have been earned in 2012, 2011 and 2010 had
performing TDRs performed in accordance with the original terms is immaterial.
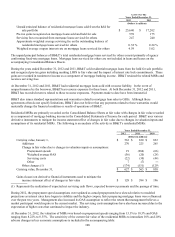
The following table provides a summary of BB&T’ s NPAs and loans 90 days or more past due and still accruing:
December 31,
2012 2011
(Dollars in millions)
N
PLs held for investmen
t
$ 1,380 $ 1,872
Foreclosed real estate (1) 107 536
Other foreclosed property 49 42
Total NPAs (excluding covered assets) (1) $ 1,536 $ 2,450
Loans 90 days or more past due and still accruing (excluding covered loans) (2)(3)(4) $ 167 $ 202
(1) Excludes covered foreclosed real estate totaling $254 million and $378 million as of December 31, 2012 and 2011,
respectively.
(2) Excludes mortgage loans guaranteed by GNMA that BB&T has the right, but not the obligation, to repurchase totaling
$517 million and $426 million as of December 31, 2012 and 2011, respectively.
(3) Excludes covered loans 90 days or more past due totaling $442 million and $736 million as of December 31, 2012 and
2011, respectively.
(4) Excludes mortgage loans 90 days or more past due that are government guaranteed totaling $254 million and $206
million as of December 31, 2012 and 2011, respectively.