BB&T 2012 Annual Report Download - page 136
Download and view the complete annual report
Please find page 136 of the 2012 BB&T annual report below. You can navigate through the pages in the report by either clicking on the pages listed below, or by using the keyword search tool below to find specific information within the annual report.-
 1
1 -
2
-
3
-
4
-
5
-
6
-
7
-
8
-
9
-
10
-
11
-
12
-
13
-
14
-
15
-
16
-
17
-
18
-
19
-
20
-
21
-
22
-
23
-
24
-
25
-
26
-
27
-
28
-
29
-
30
-
31
-
32
-
33
-
34
-
35
-
36
-
37
-
38
-
39
-
40
-
41
-
42
-
43
-
44
-
45
-
46
-
47
-
48
-
49
-
50
-
51
-
52
-
53
-
54
-
55
-
56
-
57
-
58
-
59
-
60
-
61
-
62
-
63
-
64
-
65
-
66
-
67
-
68
-
69
-
70
-
71
-
72
-
73
-
74
-
75
-
76
-
77
-
78
-
79
-
80
-
81
-
82
-
83
-
84
-
85
-
86
-
87
-
88
-
89
-
90
-
91
-
92
-
93
-
94
-
95
-
96
-
97
-
98
-
99
-
100
-
101
-
102
-
103
-
104
-
105
-
106
-
107
-
108
-
109
-
110
-
111
-
112
-
113
-
114
-
115
-
116
-
117
-
118
-
119
-
120
-
121
-
122
-
123
-
124
-
125
-
 126
126 -
 127
127 -
 128
128 -
 129
129 -
 130
130 -
 131
131 -
 132
132 -
 133
133 -
 134
134 -
 135
135 -
 136
136 -
 137
137 -
 138
138 -
 139
139 -
 140
140 -
 141
141 -
 142
142 -
 143
143 -
 144
144 -
 145
145 -
 146
146 -
147
-
148
-
149
-
150
-
151
-
152
-
153
-
154
-
155
-
156
-
157
-
158
-
159
-
160
-
161
-
162
-
163
-
164
-
165
-
166
-
167
-
168
-
169
-
170
-
171
-
172
-
173
-
174
-
175
-
176
 |
 |

114
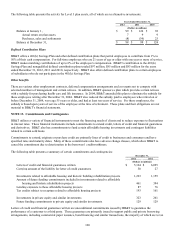
NOTE 12. Accumulated Other Comprehensive Income (Loss)
The balances in AOCI are shown in the following table:
December 31, 2012 December 31, 2011
Deferred After- Deferred After-
Pre-Tax Tax Expense Tax Pre-Tax Tax Expense Tax
Amount (Benefit) Amount Amount (Benefit) Amount
(Dollars in millions)
Unrecognized net pension and postretirement costs $ (1,146) $ (432) $ (714) $ (965) $ (362) $ (603)
Unrealized net gains (losses) on cash flow hedges (277) (104) (173) (254) (95) (159)
Unrealized net gains (losses) on securities
available for sale 960 362 598 421 158 263
FDIC’ s share of unrealized (gains) losses on
securities available for sale under loss
share agreements (410) (154) (256) (311) (116) (195)
Other, net (30) (16) (14) (37) (18) (19)
Total $ (903) $ (344) $ (559) $ (1,146) $ (433) $ (713)
As of December 31, 2012 and 2011, unrealized net losses on securities available for sale, excluding covered securities,
included $11 million and $55 million, respectively, of pre-tax losses related to other-than-temporarily impaired non-agency
RMBS where a portion of the loss was recognized in net income.
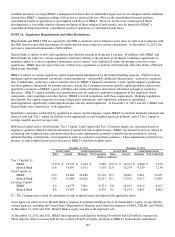
NOTE 13. Income Taxes
The provision for income taxes comprised the following:
Years Ended December 31,
2012 2011 2010
(Dollars in millions)
Current expense:
Federal $ 252 $ 83 $ 161
State 67 26 18
Foreign 2 2 2
Total current expense 321 111 181
Deferred expense (benefit):
Federal 417 163 (65)
State 26 22 (1)
Total deferred expense (benefit) 443 185 (66)
Provision for income taxes $ 764 $ 296 $ 115
The foreign income tax expense is related to income generated on assets controlled by a foreign subsidiary of Branch Bank.
The reasons for the difference between the provision for income taxes and the amount computed by applying the statutory
Federal income tax rate to income before income taxes were as follows: