BB&T 2012 Annual Report Download - page 84
Download and view the complete annual report
Please find page 84 of the 2012 BB&T annual report below. You can navigate through the pages in the report by either clicking on the pages listed below, or by using the keyword search tool below to find specific information within the annual report.-
 1
1 -
2
-
3
-
4
-
5
-
6
-
7
-
8
-
9
-
10
-
11
-
12
-
13
-
14
-
15
-
16
-
17
-
18
-
19
-
20
-
21
-
22
-
23
-
24
-
25
-
26
-
27
-
28
-
29
-
30
-
31
-
32
-
33
-
34
-
35
-
36
-
37
-
38
-
39
-
40
-
41
-
42
-
43
-
44
-
45
-
46
-
47
-
48
-
49
-
50
-
51
-
52
-
53
-
54
-
55
-
56
-
57
-
58
-
59
-
60
-
61
-
62
-
63
-
64
-
65
-
66
-
67
-
68
-
69
-
70
-
71
-
72
-
73
-
 74
74 -
 75
75 -
 76
76 -
 77
77 -
 78
78 -
 79
79 -
 80
80 -
 81
81 -
 82
82 -
 83
83 -
 84
84 -
 85
85 -
 86
86 -
 87
87 -
 88
88 -
 89
89 -
 90
90 -
 91
91 -
 92
92 -
 93
93 -
 94
94 -
95
-
96
-
97
-
98
-
99
-
100
-
101
-
102
-
103
-
104
-
105
-
106
-
107
-
108
-
109
-
110
-
111
-
112
-
113
-
114
-
115
-
116
-
117
-
118
-
119
-
120
-
121
-
122
-
123
-
124
-
125
-
126
-
127
-
128
-
129
-
130
-
131
-
132
-
133
-
134
-
135
-
136
-
137
-
138
-
139
-
140
-
141
-
142
-
143
-
144
-
145
-
146
-
147
-
148
-
149
-
150
-
151
-
152
-
153
-
154
-
155
-
156
-
157
-
158
-
159
-
160
-
161
-
162
-
163
-
164
-
165
-
166
-
167
-
168
-
169
-
170
-
171
-
172
-
173
-
174
-
175
-
176
 |
 |

62
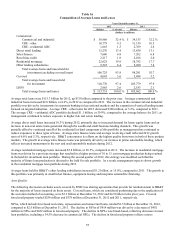
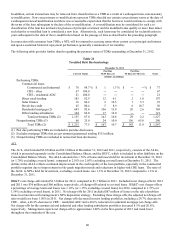
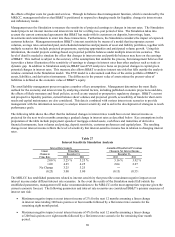
Table 23
Analysis of ACL
December 31,
2012 2011 2010 2009 2008
(Dollars in millions)
Beginning balance $ 2,285 $ 2,755 $ 2,672 $ 1,607 $ 1,015
Provision for credit losses (excluding covered loans) 1,044 1,119 2,494 2,811 1,445
Provision for covered loans 13 71 144 ― ―
Charge-offs:
Commercial (1) (732) (898) (1,508) (720) (276)
Direct retail lending (224) (276) (338) (349) (156)
Sales finance (26) (32) (48) (72) (59)
Revolving credit (81) (95) (118) (127) (79)
Residential mortgage (2) (136) (269) (394) (280) (96)
Other lending subsidiaries (225) (190) (252) (314) (251)
Covered loans (34) (66) ― ― ―
Total charge-offs (1)(2) (1,458) (1,826) (2,658) (1,862) (917)
Recoveries:
Commercial 71 71 37 21 16
Direct retail lending 36 37 33 19 12
Sales finance 10 9 9 9 7
Revolving credit 18 19 16 12 11
Residential mortgage 3 5 4 5 1
Other lending subsidiaries 26 25 31 23 19
Total recoveries 164 166 130 89 66
N
et charge-offs (1)(2) (1,294) (1,660) (2,528) (1,773) (851)
Other changes, net ― ― (27) 27 (2)
Ending balance $ 2,048 $ 2,285 $ 2,755 $ 2,672 $ 1,607
ALLL (excluding covered loans) $ 1,890 $ 2,107 $ 2,564 $ 2,600 $ 1,574
Allowance for covered loans 128 149 144 ― ―
RUFC 30 29 47 72 33
Total ACL $ 2,048 $ 2,285 $ 2,755 $ 2,672 $ 1,607
(1) Includes charge-offs of $464 million in commercial loans and leases during 2010 in connection with BB&T's NPL
disposition strategy.
(2) Includes charge-offs of $87 million and $141 million in residential mortgage loans during 2011 and 2010,
respectively, in connection with BB&T's NPL disposition strategy.
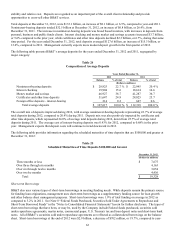
Funding Activities
Deposits are the primary source of funds for lending and investing activities. Scheduled payments, as well as prepayments,
and maturities from portfolios of loans and investment securities also provide a stable source of funds. FHLB advances,
other secured borrowings, Federal funds purchased and other short-term borrowed funds, as well as longer-term debt issued
through the capital markets, all provide supplemental liquidity sources. BB&T’ s funding activities are monitored and
governed through BB&T’ s overall asset/liability management process, which is further discussed in the “Market Risk
Management” section in “Management’ s Discussion and Analysis of Financial Condition and Results of Operations” herein.
Following is a brief description of the various sources of funds used by BB&T.
Deposits
Deposits are attracted principally from clients within BB&T’ s branch network through the offering of a broad selection of
deposit instruments to individuals and businesses, including noninterest-bearing checking accounts, interest-bearing checking
accounts, savings accounts, money market deposit accounts, CDs and individual retirement accounts. Deposit account terms
vary with respect to the minimum balance required, the time period the funds must remain on deposit and service charge
schedules. Interest rates paid on specific deposit types are determined based on (i) the interest rates offered by competitors,
(ii) the anticipated amount and timing of funding needs, (iii) the availability and cost of alternative sources of funding, and
(iv) anticipated future economic conditions and interest rates. Deposits are attractive sources of funding because of their