RBS 2005 Annual Report Download - page 100
Download and view the complete annual report
Please find page 100 of the 2005 RBS annual report below. You can navigate through the pages in the report by either clicking on the pages listed below, or by using the keyword search tool below to find specific information within the annual report.-
 1
1 -
2
-
3
-
4
-
5
-
6
-
7
-
8
-
9
-
10
-
11
-
12
-
13
-
14
-
15
-
16
-
17
-
18
-
19
-
20
-
21
-
22
-
23
-
24
-
25
-
26
-
27
-
28
-
29
-
30
-
31
-
32
-
33
-
34
-
35
-
36
-
37
-
38
-
39
-
40
-
41
-
42
-
43
-
44
-
45
-
46
-
47
-
48
-
49
-
50
-
51
-
52
-
53
-
54
-
55
-
56
-
57
-
58
-
59
-
60
-
61
-
62
-
63
-
64
-
65
-
66
-
67
-
68
-
69
-
70
-
71
-
72
-
73
-
74
-
75
-
76
-
77
-
78
-
79
-
80
-
81
-
82
-
83
-
84
-
85
-
86
-
87
-
88
-
89
-
 90
90 -
 91
91 -
 92
92 -
 93
93 -
 94
94 -
 95
95 -
 96
96 -
 97
97 -
 98
98 -
 99
99 -
 100
100 -
 101
101 -
 102
102 -
 103
103 -
 104
104 -
 105
105 -
 106
106 -
 107
107 -
 108
108 -
 109
109 -
 110
110 -
111
-
112
-
113
-
114
-
115
-
116
-
117
-
118
-
119
-
120
-
121
-
122
-
123
-
124
-
125
-
126
-
127
-
128
-
129
-
130
-
131
-
132
-
133
-
134
-
135
-
136
-
137
-
138
-
139
-
140
-
141
-
142
-
143
-
144
-
145
-
146
-
147
-
148
-
149
-
150
-
151
-
152
-
153
-
154
-
155
-
156
-
157
-
158
-
159
-
160
-
161
-
162
-
163
-
164
-
165
-
166
-
167
-
168
-
169
-
170
-
171
-
172
-
173
-
174
-
175
-
176
-
177
-
178
-
179
-
180
-
181
-
182
-
183
-
184
-
185
-
186
-
187
-
188
-
189
-
190
-
191
-
192
-
193
-
194
-
195
-
196
-
197
-
198
-
199
-
200
-
201
-
202
-
203
-
204
-
205
-
206
-
207
-
208
-
209
-
210
-
211
-
212
-
213
-
214
-
215
-
216
-
217
-
218
-
219
-
220
-
221
-
222
-
223
-
224
-
225
-
226
-
227
-
228
-
229
-
230
-
231
-
232
-
233
-
234
-
235
-
236
-
237
-
238
-
239
-
240
-
241
-
242
-
243
-
244
-
245
-
246
-
247
-
248
-
249
-
250
-
251
-
252
-
253
-
254
-
255
-
256
-
257
-
258
-
259
-
260
-
261
-
262
-
263
-
264
-
265
-
266
-
267
-
268
-
269
-
270
-
271
-
272
 |
 |

98
Operating and financial review
Operating and financial review continued
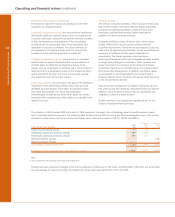
2005 2004
Net short-term wholesale market activity £m £m
Debt securities, treasury bills and other eligible bills 126,503 100,018
Reverse repo agreements with banks and customers 90,691 82,159
Less: repos with banks and customers (96,659) (85,476)
Short positions (37,427) (28,923)
Insurance Companies’ debt securities held (5,724) (5,029)
Debt securities charged as security for liabilities (9,578) (4,852)
Net marketable assets 67,806 57,897
By remaining maturity up to 1 month:
Deposits by banks (excluding repos) 35,153 34,041
Less: loans and advances to banks (gross, excluding reverse repos) (16,381) (17,067)
Debt securities in issue 20,577 15,505
Net wholesale liabilities due within 1 month 39,349 32,479
Net surplus of marketable assets over wholesale liabilities due within 1 month 28,457 25,418
Short-term liquidity risk is managed on a consolidated basis for
the whole Group excluding the activities of Citizens and
insurance businesses, which are subject to regulatory regimes
that necessitate local management of liquidity.
Internal liquidity mismatch limits are set for all other
subsidiaries and non-UK branches which have material local
treasury activities in external markets, to ensure those activities
do not compromise daily maintenance of the Group’s overall
liquidity risk position within the Group’s policy parameters.
The Group’s net surplus of marketable assets over net short-
term wholesale liabilities due within one month increased by
£3,039 million to £28,457 million at 31 December 2005.
Overall access to liquidity to meet all foreseen needs remains
comfortably within the Group’s policy parameters.
Sterling liquidity
Over 42% of the Group’s total assets are denominated in
sterling. For its sterling activity the FSA requires the Group
on a consolidated basis to maintain daily a minimum ratio
of 100% between:
1. a stock of qualifying high quality liquid assets (primarily UK
and EU government securities, treasury bills, and cash held
in branches) and
2. the sum of :
•sterling wholesale net outflows contractually due within
five working days (offset up to a limit of 50%, by 85%
of sterling certificates of deposit held which mature
beyond five working days); and
•5% of retail deposits with a residual contractual maturity
of five working days or less.
The Group exceeded the minimum ratio requirement
throughout 2005.
The FSA also set an absolute minimum level for the stock of
qualifying liquid assets that the Group is required to maintain
each day. The Group has exceeded that minimum stock
requirement at all times during 2005.
The Group’s operational processes are actively managed to
ensure that both the minimum sterling liquidity ratio and the
minimum stock requirement are achieved or exceeded at all
times.
Liquidity in non-sterling currencies
For non-sterling currencies, no specific regulatory liquidity
requirement is currently set for the Group by the FSA. However,
the importance of managing prudently the liquidity risk in its
non-sterling activities is recognised and the Group manages its
non-sterling liquidity risk daily within net mismatch limits set for
the 0-8 calendar day and 0-1 month periods as a percentage
of the Group’s total deposit and debt liabilities.
In measuring its non-sterling liquidity risk, due account is taken
of the marketability within a short period of the wide range of
debt securities held. Appropriate adjustments are applied in
each case, dependent on various parameters, to determine the
Group’s ability to realise cash at short notice via the sale or
repo of such marketable assets if required to meet
unexpected outflows.
The level of contingent risk from the potential drawing of
undrawn or partially drawn commitments, back-up lines,
standby lines and other similar facilities is also actively
monitored and reflected in the measures of the Group’s non-
sterling liquidity risk. Particular attention is given to the US$
commercial paper market and the propensity of the Group’s
corporate counterparties who are active in raising funds from
that market to switch to utilising facilities offered by the Group
in the event of either counterparty specific difficulties or a
significant widening of interest spreads generally in the
commercial paper market.