RBS 2005 Annual Report Download - page 92
Download and view the complete annual report
Please find page 92 of the 2005 RBS annual report below. You can navigate through the pages in the report by either clicking on the pages listed below, or by using the keyword search tool below to find specific information within the annual report.-
 1
1 -
2
-
3
-
4
-
5
-
6
-
7
-
8
-
9
-
10
-
11
-
12
-
13
-
14
-
15
-
16
-
17
-
18
-
19
-
20
-
21
-
22
-
23
-
24
-
25
-
26
-
27
-
28
-
29
-
30
-
31
-
32
-
33
-
34
-
35
-
36
-
37
-
38
-
39
-
40
-
41
-
42
-
43
-
44
-
45
-
46
-
47
-
48
-
49
-
50
-
51
-
52
-
53
-
54
-
55
-
56
-
57
-
58
-
59
-
60
-
61
-
62
-
63
-
64
-
65
-
66
-
67
-
68
-
69
-
70
-
71
-
72
-
73
-
74
-
75
-
76
-
77
-
78
-
79
-
80
-
81
-
 82
82 -
 83
83 -
 84
84 -
 85
85 -
 86
86 -
 87
87 -
 88
88 -
 89
89 -
 90
90 -
 91
91 -
 92
92 -
 93
93 -
 94
94 -
 95
95 -
 96
96 -
 97
97 -
 98
98 -
 99
99 -
 100
100 -
 101
101 -
 102
102 -
103
-
104
-
105
-
106
-
107
-
108
-
109
-
110
-
111
-
112
-
113
-
114
-
115
-
116
-
117
-
118
-
119
-
120
-
121
-
122
-
123
-
124
-
125
-
126
-
127
-
128
-
129
-
130
-
131
-
132
-
133
-
134
-
135
-
136
-
137
-
138
-
139
-
140
-
141
-
142
-
143
-
144
-
145
-
146
-
147
-
148
-
149
-
150
-
151
-
152
-
153
-
154
-
155
-
156
-
157
-
158
-
159
-
160
-
161
-
162
-
163
-
164
-
165
-
166
-
167
-
168
-
169
-
170
-
171
-
172
-
173
-
174
-
175
-
176
-
177
-
178
-
179
-
180
-
181
-
182
-
183
-
184
-
185
-
186
-
187
-
188
-
189
-
190
-
191
-
192
-
193
-
194
-
195
-
196
-
197
-
198
-
199
-
200
-
201
-
202
-
203
-
204
-
205
-
206
-
207
-
208
-
209
-
210
-
211
-
212
-
213
-
214
-
215
-
216
-
217
-
218
-
219
-
220
-
221
-
222
-
223
-
224
-
225
-
226
-
227
-
228
-
229
-
230
-
231
-
232
-
233
-
234
-
235
-
236
-
237
-
238
-
239
-
240
-
241
-
242
-
243
-
244
-
245
-
246
-
247
-
248
-
249
-
250
-
251
-
252
-
253
-
254
-
255
-
256
-
257
-
258
-
259
-
260
-
261
-
262
-
263
-
264
-
265
-
266
-
267
-
268
-
269
-
270
-
271
-
272
 |
 |
90
Operating and financial review
Operating and financial review continued
Credit risk assets
Credit risk assets measure the exposure to all products in the
Group’s credit portfolios which consist of loans and advances
(including overdraft facilities), instalment credit, finance lease
receivables, debt securities and other traded instruments
across all customer types.
Credit risk assets are typically analysed excluding reverse
repurchase agreements due to the short-term nature and low
credit risk associated with this product. A breakdown of credit
risk assets by division is shown below.
1 January
2005 2005
Reverse repurchase agreements £bn £bn
Banks 41.8 34.5
Customers 48.9 64.6
90.7 99.1
Reverse repurchase agreements as at 31 December 2005 were £90.7 billion (1 January 2005 – £99.1 billion), a decrease of
£8.4 billion (8%) during the year.
Credit risk asset quality
Internal reporting and oversight of risk assets is principally
differentiated by credit ratings. Internal ratings are used to
assess the credit quality of borrowers. Customers are
assigned credit ratings, based on various credit grading
models that reflect the probability of default. All credit ratings
across the Group map to a Group level asset quality scale.
Expressed as an annual probability of default, the upper and
lower boundaries and the midpoint for each of these Group
level asset quality grades are as follows:
Asset Annual probability of default
quality Minimum Midpoint Maximum S&P
grade % % % equivalent
AQ1 0.02 0.10 0.20 AAA to BBB-
AQ2 0.21 0.40 0.60 BB+ to BB
AQ3 0.61 1.05 1.50 BB- to B+
AQ4 1.51 3.25 5.00 B+ to B
AQ5 5.01 15.00 — B and below
0%
10%
20%
30%
40%
50%
AQ1 AQ2 AQ3 AQ4 AQ5
2005
2004
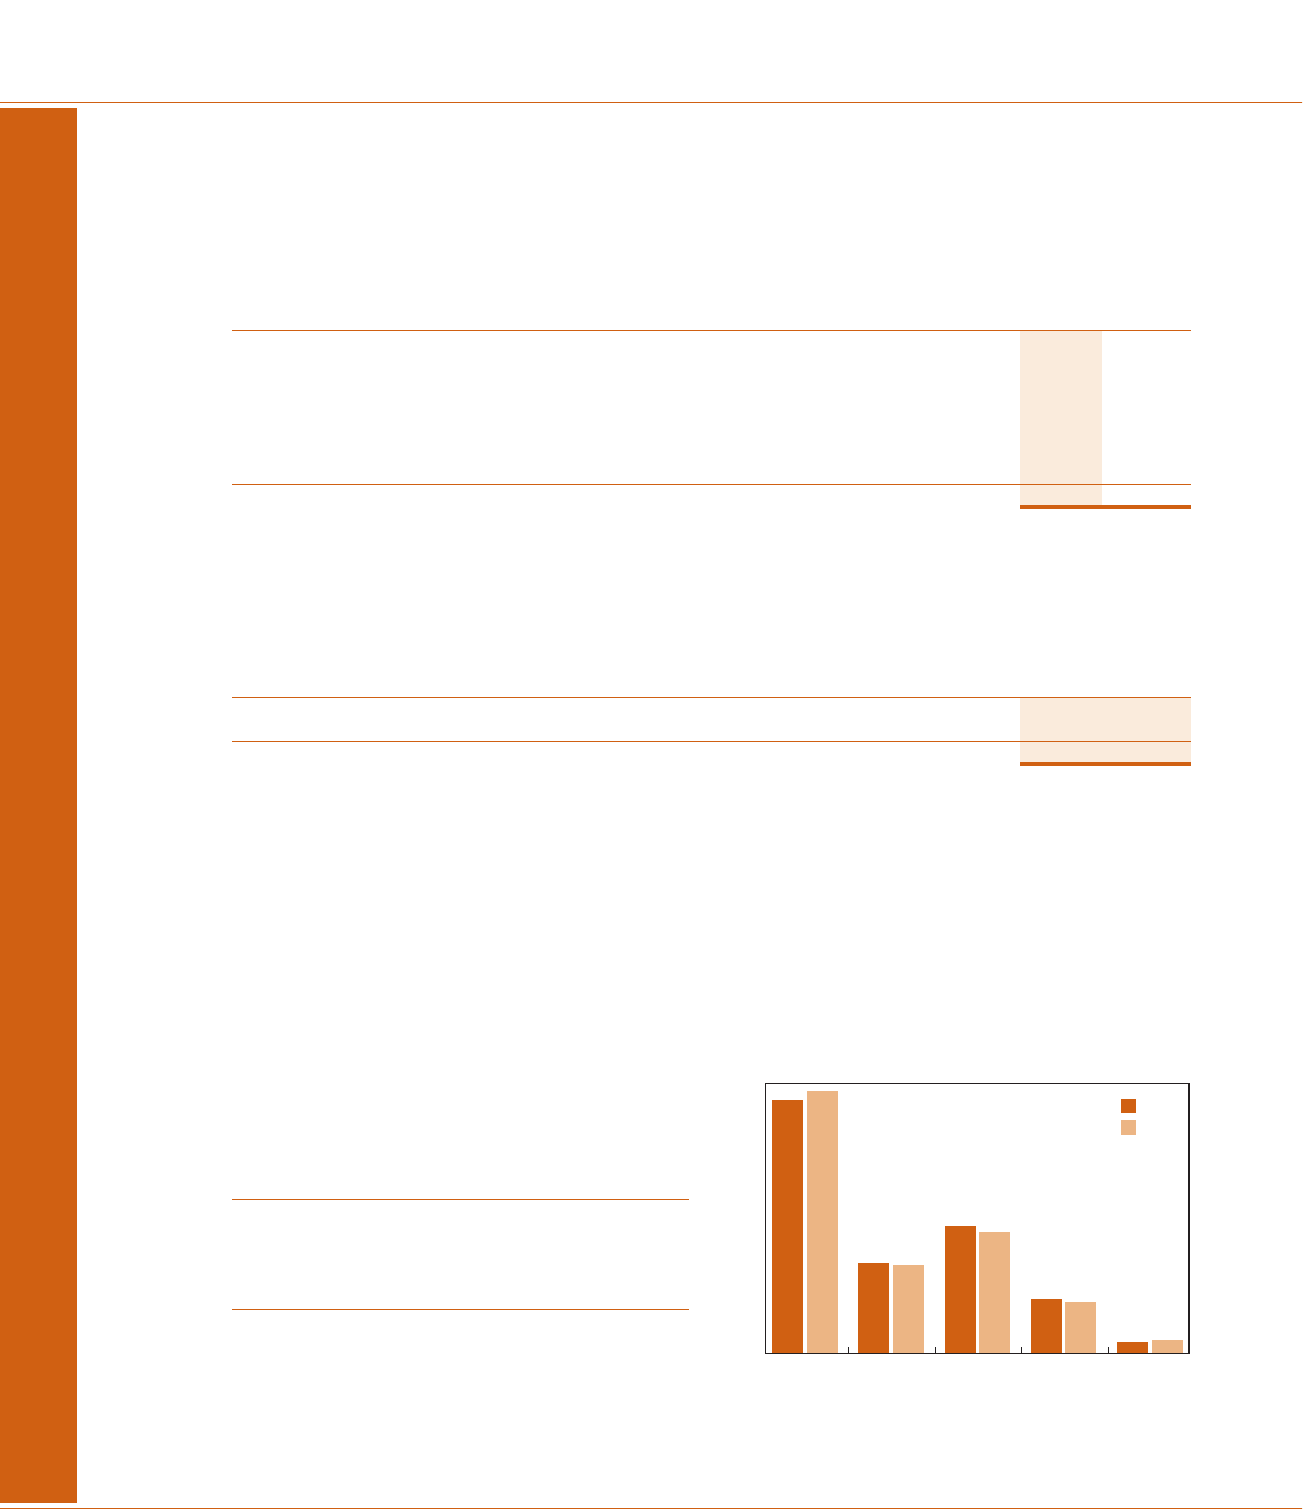
Distribution of credit risk assets by asset quality
Overall credit asset quality remained stable during 2005.
As at 31 December 2005, exposure to investment grade
counterparties (AQ1) accounted for 47% (2004 – 49%) of
credit risk assets and 98% (2004 – 97%) of exposures were to
counterparties rated AQ4 or higher. The exposure to the lowest
asset quality (AQ5) reduced from 2.6% at 31 December 2004
to 2.2% at 31 December 2005.
2005 2004
Credit risk assets £bn £bn
Corporate Markets 273.0 235.2
Retail Banking 78.0 72.2
Retail Direct 26.6 21.7
Wealth Management 8.9 10.7
Citizens 74.5 59.4
RBS Insurance 6.7 6.1
Ulster Bank 30.5 22.3
498.2 427.6
Excluding reverse repurchase agreements, credit risk assets at 31 December 2005 were £498.2 billion (2004 – £427.6 billion), an
increase of £70.6 billion (17%) during the year.
An analysis of reverse repurchase agreements is shown below.
Note: Graph data are shown net of provisions and reverse
repurchase agreements.