RBS 2005 Annual Report Download - page 74
Download and view the complete annual report
Please find page 74 of the 2005 RBS annual report below. You can navigate through the pages in the report by either clicking on the pages listed below, or by using the keyword search tool below to find specific information within the annual report.-
 1
1 -
2
-
3
-
4
-
5
-
6
-
7
-
8
-
9
-
10
-
11
-
12
-
13
-
14
-
15
-
16
-
17
-
18
-
19
-
20
-
21
-
22
-
23
-
24
-
25
-
26
-
27
-
28
-
29
-
30
-
31
-
32
-
33
-
34
-
35
-
36
-
37
-
38
-
39
-
40
-
41
-
42
-
43
-
44
-
45
-
46
-
47
-
48
-
49
-
50
-
51
-
52
-
53
-
54
-
55
-
56
-
57
-
58
-
59
-
60
-
61
-
62
-
63
-
 64
64 -
 65
65 -
 66
66 -
 67
67 -
 68
68 -
 69
69 -
 70
70 -
 71
71 -
 72
72 -
 73
73 -
 74
74 -
 75
75 -
 76
76 -
 77
77 -
 78
78 -
 79
79 -
 80
80 -
 81
81 -
 82
82 -
 83
83 -
 84
84 -
85
-
86
-
87
-
88
-
89
-
90
-
91
-
92
-
93
-
94
-
95
-
96
-
97
-
98
-
99
-
100
-
101
-
102
-
103
-
104
-
105
-
106
-
107
-
108
-
109
-
110
-
111
-
112
-
113
-
114
-
115
-
116
-
117
-
118
-
119
-
120
-
121
-
122
-
123
-
124
-
125
-
126
-
127
-
128
-
129
-
130
-
131
-
132
-
133
-
134
-
135
-
136
-
137
-
138
-
139
-
140
-
141
-
142
-
143
-
144
-
145
-
146
-
147
-
148
-
149
-
150
-
151
-
152
-
153
-
154
-
155
-
156
-
157
-
158
-
159
-
160
-
161
-
162
-
163
-
164
-
165
-
166
-
167
-
168
-
169
-
170
-
171
-
172
-
173
-
174
-
175
-
176
-
177
-
178
-
179
-
180
-
181
-
182
-
183
-
184
-
185
-
186
-
187
-
188
-
189
-
190
-
191
-
192
-
193
-
194
-
195
-
196
-
197
-
198
-
199
-
200
-
201
-
202
-
203
-
204
-
205
-
206
-
207
-
208
-
209
-
210
-
211
-
212
-
213
-
214
-
215
-
216
-
217
-
218
-
219
-
220
-
221
-
222
-
223
-
224
-
225
-
226
-
227
-
228
-
229
-
230
-
231
-
232
-
233
-
234
-
235
-
236
-
237
-
238
-
239
-
240
-
241
-
242
-
243
-
244
-
245
-
246
-
247
-
248
-
249
-
250
-
251
-
252
-
253
-
254
-
255
-
256
-
257
-
258
-
259
-
260
-
261
-
262
-
263
-
264
-
265
-
266
-
267
-
268
-
269
-
270
-
271
-
272
 |
 |

72
Operating and financial review
Operating and financial review continued
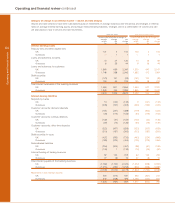
Corporate Markets – Global Banking & Markets
Pro forma
2005 2004
£m £m
Net interest income excluding funding cost of rental assets 1,652 1,527
Funding cost of rental assets (452) (370)
Net interest income 1,200 1,157
Fees and commissions receivable 1,060 871
Fees and commissions payable (252) (219)
Income from trading activities 1,964 1,681
Income on rental assets 1,074 924
Other operating income 752 330
Non-interest income 4,598 3,587
Total income 5,798 4,744
Direct expenses
– staff costs 1,471 1,216
– other 391 336
– operating lease depreciation 398 358
2,260 1,910
Contribution before impairment losses 3,538 2,834
Impairment losses 117 205
Contribution 3,421 2,629
31 December 1 January
2005 2005
£bn £bn
Total assets* 338.8 297.8
Loans and advances to customers – gross*
– banking book 90.8 77.5
– trading book 11.8 10.1
Rental assets 11.9 10.3
Customer deposits* 51.1 49.0
Weighted risk assets 128.4 112.8
* excluding repos and reverse repos
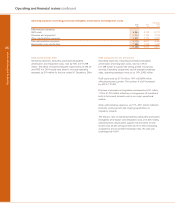
An excellent performance from our Global Banking & Markets
customer segment in 2005 shows the fruits of the global
platform we have built over the last five years, with good growth
in all major geographies and across-the-board success in
income generation from our core banking, structured finance
and financial markets activities.
Total income, after deducting operating lease depreciation,
rose by 23% to £5,400 million, with contribution up 30% to
£3,421 million, benefiting from cost discipline and continuing
benign credit conditions. Underlying income per full time
equivalent employee has grown from £646,000 in 2004 to
£718,000 in 2005.
Debt underwriting volumes remained strong throughout the
course of the year, reflecting our involvement in many of the
largest financings in the UK and Europe for both large
corporates and private equity sponsors. We were the fourth
most active bank worldwide in arranging and underwriting
bank lending in 2005. A strong distribution performance
brought weighted risk assets to £128.4 billion at year-end, up
14% over the year and back to a more consistent trend level
than the amount at mid-year.
Non-interest income grew by 28% to £4,598 million. After
deducting operating lease depreciation and rental asset
funding costs, non-interest income now accounts for 69% of
Global Banking & Markets revenues.
We recorded good growth in fees earned from customer
services in risk management, financial structuring and debt-
raising. A strong performance from RBS Greenwich Capital,
which has been brought together with other Corporate Markets
activities in North America, contributed to steady growth in
income from trading activities. Customer volumes were higher
across all products and particularly good in our credit markets
businesses. Average trading Value at Risk was held steady at a
very conservative level, £12 million.
Our continuing success in aircraft, train, ship and hotel leasing
delivered good growth in net income from rental assets. Other
operating income grew strongly, with our structured finance
investment portfolio producing good realised gains, notably in
the second half of the year.
Growth in expenses, excluding operating lease depreciation,
was 20%, reflecting variable performance-related costs.