RBS 2005 Annual Report Download - page 230
Download and view the complete annual report
Please find page 230 of the 2005 RBS annual report below. You can navigate through the pages in the report by either clicking on the pages listed below, or by using the keyword search tool below to find specific information within the annual report.-
 1
1 -
2
-
3
-
4
-
5
-
6
-
7
-
8
-
9
-
10
-
11
-
12
-
13
-
14
-
15
-
16
-
17
-
18
-
19
-
20
-
21
-
22
-
23
-
24
-
25
-
26
-
27
-
28
-
29
-
30
-
31
-
32
-
33
-
34
-
35
-
36
-
37
-
38
-
39
-
40
-
41
-
42
-
43
-
44
-
45
-
46
-
47
-
48
-
49
-
50
-
51
-
52
-
53
-
54
-
55
-
56
-
57
-
58
-
59
-
60
-
61
-
62
-
63
-
64
-
65
-
66
-
67
-
68
-
69
-
70
-
71
-
72
-
73
-
74
-
75
-
76
-
77
-
78
-
79
-
80
-
81
-
82
-
83
-
84
-
85
-
86
-
87
-
88
-
89
-
90
-
91
-
92
-
93
-
94
-
95
-
96
-
97
-
98
-
99
-
100
-
101
-
102
-
103
-
104
-
105
-
106
-
107
-
108
-
109
-
110
-
111
-
112
-
113
-
114
-
115
-
116
-
117
-
118
-
119
-
120
-
121
-
122
-
123
-
124
-
125
-
126
-
127
-
128
-
129
-
130
-
131
-
132
-
133
-
134
-
135
-
136
-
137
-
138
-
139
-
140
-
141
-
142
-
143
-
144
-
145
-
146
-
147
-
148
-
149
-
150
-
151
-
152
-
153
-
154
-
155
-
156
-
157
-
158
-
159
-
160
-
161
-
162
-
163
-
164
-
165
-
166
-
167
-
168
-
169
-
170
-
171
-
172
-
173
-
174
-
175
-
176
-
177
-
178
-
179
-
180
-
181
-
182
-
183
-
184
-
185
-
186
-
187
-
188
-
189
-
190
-
191
-
192
-
193
-
194
-
195
-
196
-
197
-
198
-
199
-
200
-
201
-
202
-
203
-
204
-
205
-
206
-
207
-
208
-
209
-
210
-
211
-
212
-
213
-
214
-
215
-
216
-
217
-
218
-
219
-
 220
220 -
 221
221 -
 222
222 -
 223
223 -
 224
224 -
 225
225 -
 226
226 -
 227
227 -
 228
228 -
 229
229 -
 230
230 -
 231
231 -
 232
232 -
 233
233 -
 234
234 -
 235
235 -
 236
236 -
 237
237 -
 238
238 -
 239
239 -
 240
240 -
241
-
242
-
243
-
244
-
245
-
246
-
247
-
248
-
249
-
250
-
251
-
252
-
253
-
254
-
255
-
256
-
257
-
258
-
259
-
260
-
261
-
262
-
263
-
264
-
265
-
266
-
267
-
268
-
269
-
270
-
271
-
272
 |
 |

228
Notes on the accounts
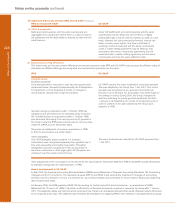
Earnings per share
Basic and diluted earnings per share (“EPS”) under US GAAP differ from IFRS only to the extent that the income calculated under US
GAAP differs from that under IFRS.
2005 2004
No. of Per share No. of Per share
Income* shares amount Income* shares amount
£m million pence £m million pence
Basic EPS 4,475 3,183 140.6 3,909 3,085 126.7
Dilutive effect of share options and convertible preference shares 65 60 (0.6) 66 73 (0.8)
Diluted EPS 4,540 3,243 140.0 3,975 3,158 125.9
* US GAAP net income available to ordinary shareholders, see page 227.
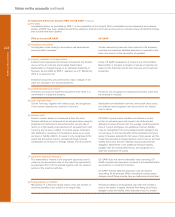
Pensions
On 1 April 2002, the Group’s main pension schemes, The
Royal Bank of Scotland Staff Pension Scheme and the National
Westminster Bank Pension Fund, were merged to form The
Royal Bank of Scotland Group Pension Fund (“the plan”).
The provisions of SFAS 87 ‘Employers’ Accounting for
Pensions’ have been applied to the plan, which covers most of
the Group’s UK employees; the impact of US GAAP on the
other Group schemes is considered to be immaterial.
A trust fund has been established under the plan, to which
payments are made, determined on an actuarial basis,
designed to build up reserves during the working life of full-
time employees to pay such employees or their dependants a
pension after retirement. Such pensions are based on final
pensionable salaries and are related to the length of service
prior to retirement. Pensions are limited to a maximum of
two-thirds of final salary for 40 years service or more. Staff do
not make contributions for basic pensions but may make
voluntary contributions on a regular basis to purchase
additional service qualification where less than 40 years
service will have been completed by normal retirement age.
The assets of the plan are held under separate trusts and, in
the long-term, the funding policy is to maintain assets sufficient
to cover the benefits in respect of service to date, with due
allowance for future earnings increases. The plan assets
consist mainly of fixed-income securities and listed securities.
The investment policy followed for the plan seeks to deploy the
plan assets primarily in UK and overseas equity shares and UK
government securities.
Disclosures required by SFAS 132R for the Group’s main scheme
are set out below.
The Group has convertible preference shares totalling £200
million (2004 – £200 million), nil million (2004 – 750 million)
and $1,000 million (2004 – $1,900 million). All of the convertible
preference shares have a dilutive effect in the current year and
as such have been included in the computation of diluted
earnings per share.
Outstanding options to purchase shares are excluded from the
computation of diluted EPS where the exercise prices of
the options are greater than the average market price of the
ordinary shares during the relevant period. At 31 December
2005, there were 17.3 million such options outstanding (2004 –
8.7 million).
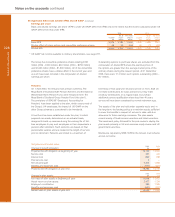
Obligations and funded status
2005 2004
Change in benefit obligation: £m £m
Projected benefit obligation at beginning of year 16,192 13,963
Service cost 457 420
Interest cost 860 768
Past service cost 3 —
Net actuarial gain 2,302 1,568
Benefits and expenses paid (521) (527)
Projected benefit obligation at year end 19,293 16,192
2005 2004
Change in plan assets: £m £m
Fair value of plan assets at beginning of year 13,598 11,822
Actual return on plan assets 2,477 1,234
Employer’s contribution 380 1,069
Benefits and expenses paid (521) (527)
Market value of plan assets at year end 15,934 13,598
Notes on the accounts continued
46 Significant differences between IFRS and US GAAP (continued)