RBS 2005 Annual Report Download - page 77
Download and view the complete annual report
Please find page 77 of the 2005 RBS annual report below. You can navigate through the pages in the report by either clicking on the pages listed below, or by using the keyword search tool below to find specific information within the annual report.-
 1
1 -
2
-
3
-
4
-
5
-
6
-
7
-
8
-
9
-
10
-
11
-
12
-
13
-
14
-
15
-
16
-
17
-
18
-
19
-
20
-
21
-
22
-
23
-
24
-
25
-
26
-
27
-
28
-
29
-
30
-
31
-
32
-
33
-
34
-
35
-
36
-
37
-
38
-
39
-
40
-
41
-
42
-
43
-
44
-
45
-
46
-
47
-
48
-
49
-
50
-
51
-
52
-
53
-
54
-
55
-
56
-
57
-
58
-
59
-
60
-
61
-
62
-
63
-
64
-
65
-
66
-
 67
67 -
 68
68 -
 69
69 -
 70
70 -
 71
71 -
 72
72 -
 73
73 -
 74
74 -
 75
75 -
 76
76 -
 77
77 -
 78
78 -
 79
79 -
 80
80 -
 81
81 -
 82
82 -
 83
83 -
 84
84 -
 85
85 -
 86
86 -
 87
87 -
88
-
89
-
90
-
91
-
92
-
93
-
94
-
95
-
96
-
97
-
98
-
99
-
100
-
101
-
102
-
103
-
104
-
105
-
106
-
107
-
108
-
109
-
110
-
111
-
112
-
113
-
114
-
115
-
116
-
117
-
118
-
119
-
120
-
121
-
122
-
123
-
124
-
125
-
126
-
127
-
128
-
129
-
130
-
131
-
132
-
133
-
134
-
135
-
136
-
137
-
138
-
139
-
140
-
141
-
142
-
143
-
144
-
145
-
146
-
147
-
148
-
149
-
150
-
151
-
152
-
153
-
154
-
155
-
156
-
157
-
158
-
159
-
160
-
161
-
162
-
163
-
164
-
165
-
166
-
167
-
168
-
169
-
170
-
171
-
172
-
173
-
174
-
175
-
176
-
177
-
178
-
179
-
180
-
181
-
182
-
183
-
184
-
185
-
186
-
187
-
188
-
189
-
190
-
191
-
192
-
193
-
194
-
195
-
196
-
197
-
198
-
199
-
200
-
201
-
202
-
203
-
204
-
205
-
206
-
207
-
208
-
209
-
210
-
211
-
212
-
213
-
214
-
215
-
216
-
217
-
218
-
219
-
220
-
221
-
222
-
223
-
224
-
225
-
226
-
227
-
228
-
229
-
230
-
231
-
232
-
233
-
234
-
235
-
236
-
237
-
238
-
239
-
240
-
241
-
242
-
243
-
244
-
245
-
246
-
247
-
248
-
249
-
250
-
251
-
252
-
253
-
254
-
255
-
256
-
257
-
258
-
259
-
260
-
261
-
262
-
263
-
264
-
265
-
266
-
267
-
268
-
269
-
270
-
271
-
272
 |
 |

section
01
Operating and
financial review
75
Operating and financial review
Annual Report and Accounts 2005
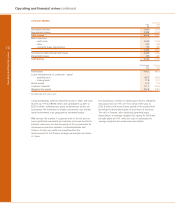
Retail Direct
Pro forma
2005 2004
£m £m
Net interest income 882 779
Non-interest income 1,084 995
Total income 1,966 1,774
Direct expenses
– staff costs 230 225
– other 375 391
605 616
Contribution before impairment losses 1,361 1,158
Impairment losses 571 410
Contribution 790 748
31 December 1 January
2005 2005
£bn £bn
Total assets 27.2 23.0
Loans and advances to customers – gross
– mortgages 13.8 9.4
– cards 9.5 9.3
– other 4.0 3.8
Customer deposits 2.7 2.8
Weighted risk assets 20.5 19.4
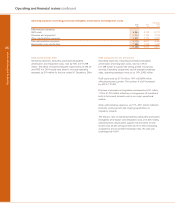
Total income rose by 11% to £1,966 million and contribution by
6% to £790 million, a strong performance in the context of
slower growth in demand for unsecured credit and higher
levels of consumer arrears. This performance reflected
disciplined pricing, tight cost control and stringent credit
assessment. Contribution before impairment losses increased
by 18% to £1,361 million.
During the year, the number of customer accounts increased
by 734,000 (4%). In the light of changing market conditions we
have focussed our marketing efforts on existing customers,
and this has resulted in very strong growth in our core NatWest
and RBS brands. We gained 336,000 credit card accounts in
these brands in the second half, 60% more than in the
equivalent period of 2004.
Net interest income increased by 13% to £882 million, reflecting
the success of the First Active brand in the UK mortgage
market and the maturing of the MINT portfolio. MINT, launched
in December 2003, made a contribution of £37 million in 2005.
Average loans and advances rose by 15% to £24.9 billion
with the fastest growth coming in mortgages, up 34% at
£11.9 billion. Personal loan growth slowed, reflecting strategic
decisions taken over the last 18 months to reposition pricing
and tighten lending criteria for personal loans sold directly.
Net interest margin was only slightly lower than in 2004, as
wider margins on our cards portfolio balanced the effects of
the increasing weight of mortgage assets in our loan book.
Non-interest income was up 9% to £1,084 million, benefiting
from higher volumes in both domestic and international card
acquiring, strong sales through Tesco Personal Finance, the
introduction of balance transfer fees and good growth in
Europe.
Expenses decreased by 2% to £605 million, with stringent cost
control across all activities, including reduced marketing costs
on personal loans. This was consistent with our more cautious
approach to direct lending and with our successful focus on
branch recruitment.
Impairment losses rose by 39% to £571 million, reflecting
higher lending volumes as well as the increase in personal
arrears signalled at the end of 2004. There are some signs of
a stabilisation of credit quality, assisted by the tightening of
lending criteria. Mortgage arrears remain very low. The
average loan-to-value ratio on new mortgages written in 2005
was 51% and on the stock of mortgages was 44%.