RBS 2005 Annual Report Download - page 240
Download and view the complete annual report
Please find page 240 of the 2005 RBS annual report below. You can navigate through the pages in the report by either clicking on the pages listed below, or by using the keyword search tool below to find specific information within the annual report.-
 1
1 -
2
-
3
-
4
-
5
-
6
-
7
-
8
-
9
-
10
-
11
-
12
-
13
-
14
-
15
-
16
-
17
-
18
-
19
-
20
-
21
-
22
-
23
-
24
-
25
-
26
-
27
-
28
-
29
-
30
-
31
-
32
-
33
-
34
-
35
-
36
-
37
-
38
-
39
-
40
-
41
-
42
-
43
-
44
-
45
-
46
-
47
-
48
-
49
-
50
-
51
-
52
-
53
-
54
-
55
-
56
-
57
-
58
-
59
-
60
-
61
-
62
-
63
-
64
-
65
-
66
-
67
-
68
-
69
-
70
-
71
-
72
-
73
-
74
-
75
-
76
-
77
-
78
-
79
-
80
-
81
-
82
-
83
-
84
-
85
-
86
-
87
-
88
-
89
-
90
-
91
-
92
-
93
-
94
-
95
-
96
-
97
-
98
-
99
-
100
-
101
-
102
-
103
-
104
-
105
-
106
-
107
-
108
-
109
-
110
-
111
-
112
-
113
-
114
-
115
-
116
-
117
-
118
-
119
-
120
-
121
-
122
-
123
-
124
-
125
-
126
-
127
-
128
-
129
-
130
-
131
-
132
-
133
-
134
-
135
-
136
-
137
-
138
-
139
-
140
-
141
-
142
-
143
-
144
-
145
-
146
-
147
-
148
-
149
-
150
-
151
-
152
-
153
-
154
-
155
-
156
-
157
-
158
-
159
-
160
-
161
-
162
-
163
-
164
-
165
-
166
-
167
-
168
-
169
-
170
-
171
-
172
-
173
-
174
-
175
-
176
-
177
-
178
-
179
-
180
-
181
-
182
-
183
-
184
-
185
-
186
-
187
-
188
-
189
-
190
-
191
-
192
-
193
-
194
-
195
-
196
-
197
-
198
-
199
-
200
-
201
-
202
-
203
-
204
-
205
-
206
-
207
-
208
-
209
-
210
-
211
-
212
-
213
-
214
-
215
-
216
-
217
-
218
-
219
-
220
-
221
-
222
-
223
-
224
-
225
-
226
-
227
-
228
-
229
-
 230
230 -
 231
231 -
 232
232 -
 233
233 -
 234
234 -
 235
235 -
 236
236 -
 237
237 -
 238
238 -
 239
239 -
 240
240 -
 241
241 -
 242
242 -
 243
243 -
 244
244 -
 245
245 -
 246
246 -
 247
247 -
 248
248 -
 249
249 -
 250
250 -
251
-
252
-
253
-
254
-
255
-
256
-
257
-
258
-
259
-
260
-
261
-
262
-
263
-
264
-
265
-
266
-
267
-
268
-
269
-
270
-
271
-
272
 |
 |

238
Additional information
Additional information continued
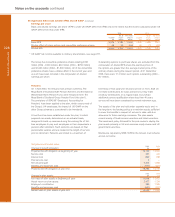
Risk elements in lending and potential problem loans
The Group’s loan control and review procedures do not include the classification of loans as non-accrual, accruing past due,
restructured and potential problem loans, as defined by the SEC in the US. The following table shows the estimated amount of
loans that would be reported using the SEC’s classifications. The figures are stated before deducting the value of security held or
related provisions.
IAS 39 requires interest to be recognised on a financial asset (or a group of financial assets) after impairment at the rate of interest used
to discount recoveries when measuring the impairment loss. Thus, interest on impaired financial assets is credited to profit or loss as the
discount on expected recoveries unwinds. Despite this, such assets are not considered performing. All loans that have an impairment
provision are classified as non-accrual. This is a change from past practice where certain loans with provisions were classified as past
due 90 days or potential problem loans (and interest accrued on them).
IFRS
2005 2004
£m £m
Loans accounted for on a non-accrual basis (2):
Domestic 4,977 3,658
Foreign 949 1,075
Total 5,926 4,733
Accruing loans which are contractually overdue 90 days or more as to principal or interest (3):
Domestic 2 634
Foreign 7 79
Total 9713
Loans not included above which are classified as ‘troubled debt restructurings’ by the SEC:
Domestic 2 14
Foreign — 10
Total 224
Total risk elements in lending 5,937 5,470
Potential problem loans (4)
Domestic 14 173
Foreign 5 107
Total potential problem loans 19 280
Closing provisions for impairment as a % of total risk elements in lending 65% 76%
Closing provisions for impairment as a % of total risk elements in lending and potential problem loans 65% 72%
Risk elements in lending as a % of gross lending to customers excluding reverse repos 1.60% 1.83%
Notes:
(1) For the analysis above, 'Domestic' consists of the United Kingdom domestic transactions of the Group. 'Foreign' comprises the Group’s transactions conducted through offices
outside the UK and through those offices in the UK specifically organised to service international banking transactions.
(2) All loans against which an impairment provision is held are reported in the non-accrual category.
(3) Loans where an impairment event has taken place but no impairment recognised. This category is used for over-collateralised non-revolving credit facilities.
(4) Loans for which an impairment event has occurred but no impairment provision is necessary. This category is used for over-collateralised advances and revolving credit facilities
where identification as 90 days overdue is not feasible.
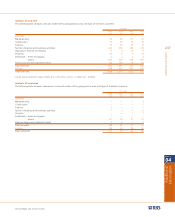
IFRS
2005 2004
£m £m
Gross income not recognised but which would have been
recognised under the original terms of non-accrual and restructured loans
Domestic 334 235
Foreign 62 58
396 293
Interest on non-accrual and restructured loans included in net interest income
Domestic 130 58
Foreign 14 7
144 65