RBS 2005 Annual Report Download - page 85
Download and view the complete annual report
Please find page 85 of the 2005 RBS annual report below. You can navigate through the pages in the report by either clicking on the pages listed below, or by using the keyword search tool below to find specific information within the annual report.-
 1
1 -
2
-
3
-
4
-
5
-
6
-
7
-
8
-
9
-
10
-
11
-
12
-
13
-
14
-
15
-
16
-
17
-
18
-
19
-
20
-
21
-
22
-
23
-
24
-
25
-
26
-
27
-
28
-
29
-
30
-
31
-
32
-
33
-
34
-
35
-
36
-
37
-
38
-
39
-
40
-
41
-
42
-
43
-
44
-
45
-
46
-
47
-
48
-
49
-
50
-
51
-
52
-
53
-
54
-
55
-
56
-
57
-
58
-
59
-
60
-
61
-
62
-
63
-
64
-
65
-
66
-
67
-
68
-
69
-
70
-
71
-
72
-
73
-
74
-
 75
75 -
 76
76 -
 77
77 -
 78
78 -
 79
79 -
 80
80 -
 81
81 -
 82
82 -
 83
83 -
 84
84 -
 85
85 -
 86
86 -
 87
87 -
 88
88 -
 89
89 -
 90
90 -
 91
91 -
 92
92 -
 93
93 -
 94
94 -
 95
95 -
96
-
97
-
98
-
99
-
100
-
101
-
102
-
103
-
104
-
105
-
106
-
107
-
108
-
109
-
110
-
111
-
112
-
113
-
114
-
115
-
116
-
117
-
118
-
119
-
120
-
121
-
122
-
123
-
124
-
125
-
126
-
127
-
128
-
129
-
130
-
131
-
132
-
133
-
134
-
135
-
136
-
137
-
138
-
139
-
140
-
141
-
142
-
143
-
144
-
145
-
146
-
147
-
148
-
149
-
150
-
151
-
152
-
153
-
154
-
155
-
156
-
157
-
158
-
159
-
160
-
161
-
162
-
163
-
164
-
165
-
166
-
167
-
168
-
169
-
170
-
171
-
172
-
173
-
174
-
175
-
176
-
177
-
178
-
179
-
180
-
181
-
182
-
183
-
184
-
185
-
186
-
187
-
188
-
189
-
190
-
191
-
192
-
193
-
194
-
195
-
196
-
197
-
198
-
199
-
200
-
201
-
202
-
203
-
204
-
205
-
206
-
207
-
208
-
209
-
210
-
211
-
212
-
213
-
214
-
215
-
216
-
217
-
218
-
219
-
220
-
221
-
222
-
223
-
224
-
225
-
226
-
227
-
228
-
229
-
230
-
231
-
232
-
233
-
234
-
235
-
236
-
237
-
238
-
239
-
240
-
241
-
242
-
243
-
244
-
245
-
246
-
247
-
248
-
249
-
250
-
251
-
252
-
253
-
254
-
255
-
256
-
257
-
258
-
259
-
260
-
261
-
262
-
263
-
264
-
265
-
266
-
267
-
268
-
269
-
270
-
271
-
272
 |
 |

section
01
Operating and
financial review
83
Operating and financial review
Annual Report and Accounts 2005
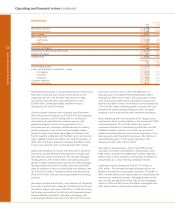
Overview of consolidated balance sheet
To provide a more meaningful comparison, the commentary
below compares the balance sheet at 31 December 2005 with
the opening balance sheet at 1 January 2005, which includes
the effect of applying IAS 32, IAS 39 and IFRS 4 from that date.
31 December 2005 compared with 1 January 2005
Total assets of £776.8 billion at 31 December 2005 were up
£80.3 billion, 12% compared with 1 January 2005, reflecting
business growth.
Treasury bills and other eligible bills decreased by £0.6 billion,
9%, to £5.5 billion, reflecting trading activity.
Loans and advances to banks increased £4.9 billion, 7%, to
£70.6 billion. Growth in reverse repurchase agreements and
stock borrowing (“reverse repos”) up £7.3 billion, 21%, to
£41.8 billion, were partially offset by a reduction in bank
placings, down £2.4 billion, 8% to £28.8 billion.
Loans and advances to customers were up £36.1 billion, 9%,
to £417.2 billion. Within this, reverse repos decreased by 24%,
£15.7 billion to £48.9 billion. Excluding reverse repos, lending
rose by £51.8 billion, 16% to £368.3 billion reflecting organic
growth across all divisions.
Debt securities increased by £27.1 billion, 29%, to £121.0
billion and Equity shares rose by £4.1 billion, 78%, to £9.3
billion, principally due to increased holdings in Corporate
Markets.
Intangible assets increased by £0.7 billion, 4% to £19.9 billion
largely due to exchange rate movements.
Property, plant and equipment were up £1.6 billion, 10% to
£18.1 billion, primarily reflecting growth in operating lease
assets.
Derivatives at fair value, assets and liabilities, have increased
reflecting growth in trading volumes and the effects of interest
and exchange rates.
Deposits by banks rose by £4.4 billion, 4% to £110.4 billion to
fund business growth mainly through increased inter-bank
deposits, up £4.3 billion, 7% to £62.5 billion. Repurchase
agreements and stock lending (“repos”) were broadly flat at
£47.9 billion.
Customer accounts were up £27.8 billion, 9% at £342.9 billion.
Within this, repos decreased £5.7 billion, 11% to £48.8 billion.
Excluding repos, deposits rose by £33.5 billion, 13%, to £294.1
billion with good growth in all divisions.
Debt securities in issue increased by £24.2 billion, 36%, to
£90.4 billion primarily to meet the Group’s funding
requirements.
The increase in settlement balances and short positions, up
£10.6 billion, 32%, to £44.0 billion, reflected growth in
customer activity.
Subordinated liabilities were up £0.7 billion, 3% to £28.3 billion.
This reflected the issue of £1.2 billion dated loan capital and
the effect of exchange rate movements, £1.3 billion, which was
partially offset by the redemption of £1.6 billion non-cumulative
preference shares and dated loan capital.
Equity minority interests increased by £1.2 billion to £2.1 billion
reflecting the co-investors interest in the Group’s subsidiary
that invested in Bank of China and the issuance of preferred
securities.
Shareholders’ equity increased by £5.4 billion, 18% to £35.4
billion. The profit for the year of £5.5 billion, issue of £1.6
billion non-cumulative fixed rate equity preference shares and
£0.3 billion of ordinary shares in respect of scrip dividends
and the exercise of share options, were partly offset by the
payment of the 2004 final ordinary dividend, £1.3 billion, and
the 2005 interim ordinary dividend, £0.6 billion and preference
dividends, £0.1 billion.
The fair value of the assets of the Group’s post-retirement
benefit schemes was £17.4 billion (2004 – £14.8 billion) and
the present value of defined benefit obligations was £21.1
billion (2004 – £17.7 billion). The increase in net pension
liability (after tax) to £2.7 billion from £2.1 billion is principally
due to movements in interest rates. The mortality assumptions
used in the valuation of liabilities were updated at the end of
2004 and have not been changed.