RBS 2005 Annual Report Download - page 68
Download and view the complete annual report
Please find page 68 of the 2005 RBS annual report below. You can navigate through the pages in the report by either clicking on the pages listed below, or by using the keyword search tool below to find specific information within the annual report.-
 1
1 -
2
-
3
-
4
-
5
-
6
-
7
-
8
-
9
-
10
-
11
-
12
-
13
-
14
-
15
-
16
-
17
-
18
-
19
-
20
-
21
-
22
-
23
-
24
-
25
-
26
-
27
-
28
-
29
-
30
-
31
-
32
-
33
-
34
-
35
-
36
-
37
-
38
-
39
-
40
-
41
-
42
-
43
-
44
-
45
-
46
-
47
-
48
-
49
-
50
-
51
-
52
-
53
-
54
-
55
-
56
-
57
-
 58
58 -
 59
59 -
 60
60 -
 61
61 -
 62
62 -
 63
63 -
 64
64 -
 65
65 -
 66
66 -
 67
67 -
 68
68 -
 69
69 -
 70
70 -
 71
71 -
 72
72 -
 73
73 -
 74
74 -
 75
75 -
 76
76 -
 77
77 -
 78
78 -
79
-
80
-
81
-
82
-
83
-
84
-
85
-
86
-
87
-
88
-
89
-
90
-
91
-
92
-
93
-
94
-
95
-
96
-
97
-
98
-
99
-
100
-
101
-
102
-
103
-
104
-
105
-
106
-
107
-
108
-
109
-
110
-
111
-
112
-
113
-
114
-
115
-
116
-
117
-
118
-
119
-
120
-
121
-
122
-
123
-
124
-
125
-
126
-
127
-
128
-
129
-
130
-
131
-
132
-
133
-
134
-
135
-
136
-
137
-
138
-
139
-
140
-
141
-
142
-
143
-
144
-
145
-
146
-
147
-
148
-
149
-
150
-
151
-
152
-
153
-
154
-
155
-
156
-
157
-
158
-
159
-
160
-
161
-
162
-
163
-
164
-
165
-
166
-
167
-
168
-
169
-
170
-
171
-
172
-
173
-
174
-
175
-
176
-
177
-
178
-
179
-
180
-
181
-
182
-
183
-
184
-
185
-
186
-
187
-
188
-
189
-
190
-
191
-
192
-
193
-
194
-
195
-
196
-
197
-
198
-
199
-
200
-
201
-
202
-
203
-
204
-
205
-
206
-
207
-
208
-
209
-
210
-
211
-
212
-
213
-
214
-
215
-
216
-
217
-
218
-
219
-
220
-
221
-
222
-
223
-
224
-
225
-
226
-
227
-
228
-
229
-
230
-
231
-
232
-
233
-
234
-
235
-
236
-
237
-
238
-
239
-
240
-
241
-
242
-
243
-
244
-
245
-
246
-
247
-
248
-
249
-
250
-
251
-
252
-
253
-
254
-
255
-
256
-
257
-
258
-
259
-
260
-
261
-
262
-
263
-
264
-
265
-
266
-
267
-
268
-
269
-
270
-
271
-
272
 |
 |

66
Operating and financial review
Operating and financial review continued
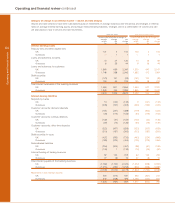
Operating expenses (excluding purchased intangibles amortisation and integration costs)
Pro forma
2005 2004 2004
£m £m £m
Administrative expenses:
Staff costs 5,844 5,105 5,131
Premises and equipment 1,274 1,142 1,143
Other administrative expenses 2,592 2,174 2,221
Total administrative expenses 9,710 8,421 8,495
Depreciation and amortisation 1,588 1,376 1,376
11,298 9,797 9,871
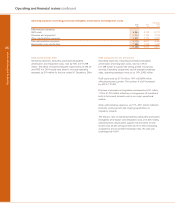
2005 compared with 2004
Operating expenses, excluding purchased intangibles
amortisation and integration costs, rose by 15% to £11,298
million. The effect of implementing the requirements of IAS 39
and IFRS 4 in 2004 would have been to increase operating
expenses by £74 million for the year ended 31 December 2004.
2005 compared with pro forma 2004
Operating expenses, excluding purchased intangibles
amortisation and integration costs, rose by 14% to
£11,298 million to support the strong growth in business
volumes. Excluding acquisitions and at constant exchange
rates, operating expenses were up by 10%, £962 million.
Staff costs were up £713 million, 14% to £5,844 million
reflecting business growth. The number of staff increased
by 400 to 137,000.
Premises and equipment expenses increased by £131 million,
11% to £1,274 million reflecting our programme of investment
both in the branch networks and in our major operational
centres.
Other administrative expenses, up 17%, £371 million reflected
business volume growth and ongoing expenditure on
regulatory projects.
The Group’s ratio of operating expenses (excluding purchased
intangibles amortisation and integration costs and after netting
operating lease depreciation against rental income) to total
income was 42.4% compared with 42.0% in 2004. Excluding
acquisitions and at constant exchange rates, the ratio was
unchanged at 41.8%.