RBS 2005 Annual Report Download - page 4
Download and view the complete annual report
Please find page 4 of the 2005 RBS annual report below. You can navigate through the pages in the report by either clicking on the pages listed below, or by using the keyword search tool below to find specific information within the annual report.-
 1
1 -
 2
2 -
 3
3 -
 4
4 -
 5
5 -
 6
6 -
 7
7 -
 8
8 -
 9
9 -
 10
10 -
 11
11 -
 12
12 -
 13
13 -
 14
14 -
 15
15 -
16
-
17
-
18
-
19
-
20
-
21
-
22
-
23
-
24
-
25
-
26
-
27
-
28
-
29
-
30
-
31
-
32
-
33
-
34
-
35
-
36
-
37
-
38
-
39
-
40
-
41
-
42
-
43
-
44
-
45
-
46
-
47
-
48
-
49
-
50
-
51
-
52
-
53
-
54
-
55
-
56
-
57
-
58
-
59
-
60
-
61
-
62
-
63
-
64
-
65
-
66
-
67
-
68
-
69
-
70
-
71
-
72
-
73
-
74
-
75
-
76
-
77
-
78
-
79
-
80
-
81
-
82
-
83
-
84
-
85
-
86
-
87
-
88
-
89
-
90
-
91
-
92
-
93
-
94
-
95
-
96
-
97
-
98
-
99
-
100
-
101
-
102
-
103
-
104
-
105
-
106
-
107
-
108
-
109
-
110
-
111
-
112
-
113
-
114
-
115
-
116
-
117
-
118
-
119
-
120
-
121
-
122
-
123
-
124
-
125
-
126
-
127
-
128
-
129
-
130
-
131
-
132
-
133
-
134
-
135
-
136
-
137
-
138
-
139
-
140
-
141
-
142
-
143
-
144
-
145
-
146
-
147
-
148
-
149
-
150
-
151
-
152
-
153
-
154
-
155
-
156
-
157
-
158
-
159
-
160
-
161
-
162
-
163
-
164
-
165
-
166
-
167
-
168
-
169
-
170
-
171
-
172
-
173
-
174
-
175
-
176
-
177
-
178
-
179
-
180
-
181
-
182
-
183
-
184
-
185
-
186
-
187
-
188
-
189
-
190
-
191
-
192
-
193
-
194
-
195
-
196
-
197
-
198
-
199
-
200
-
201
-
202
-
203
-
204
-
205
-
206
-
207
-
208
-
209
-
210
-
211
-
212
-
213
-
214
-
215
-
216
-
217
-
218
-
219
-
220
-
221
-
222
-
223
-
224
-
225
-
226
-
227
-
228
-
229
-
230
-
231
-
232
-
233
-
234
-
235
-
236
-
237
-
238
-
239
-
240
-
241
-
242
-
243
-
244
-
245
-
246
-
247
-
248
-
249
-
250
-
251
-
252
-
253
-
254
-
255
-
256
-
257
-
258
-
259
-
260
-
261
-
262
-
263
-
264
-
265
-
266
-
267
-
268
-
269
-
270
-
271
-
272
 |
 |

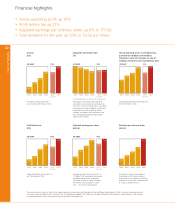
Financial highlights
Financial highlights
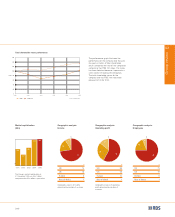
Adjusted earnings per share
(pence)
The Group’s total income grew
by 14% to £25,569 million in 2005.
Group operating profit increased by 16%
to £8,251 million in 2005.
Group profit before tax rose by 21%
to £7,936 million in 2005.
Profit before tax
(£m)
2001 2002 2003 2004
5,778
6,540
7,068
8,101
2001 2002 2003 20042001 2002 2003 2004 2004
pro forma
2005
14,558
17,016
19,281
22,754 22,515
25,569
UK GAAP IFRS UK GAAP IFRS UK GAAP IFRS
2004
pro forma
2005
7,108
8,251
2004*
pro forma
2005*
45.3 44.2
42.6
40.8 41.8 41.8
2001 2002 2003 2004
127.9
146.3
157.2
172.5
2001 2002 2003 2004
4,252
4,852
6,076
6,917
UK GAAP IFRS UK GAAP IFRS
2004
pro forma
2005
6,543
7,936
2004
pro forma
2005
162.6
175.9
2001 2002 2003 2004 2005
38.0
43.7
50.3
58.0
72.5
Income
(£m)
Adjusted cost:income ratio
(%)
Group operating profit – profit before tax,
purchased intangibles amortisation,
integration costs and net gain on sale of
strategic investments and subsidiaries (£m)
Earnings per share increased by 8% to
175.9p for 2005, adjusted for purchased
intangibles amortisation, integration
costs and net gain on sale of strategic
investments and subsidiaries, and in
2001 – 2003 for the AVS dividend.
Dividend per ordinary share
(pence)
The directors have recommended a
final dividend of 53.1p per ordinary
share which, when added to the interim
dividend of 19.4p, makes a total for 2005
of 72.5p, an increase of 25%.
*excluding acquisitions and at constant exchange rates
The Group’s cost:income ratio, excluding
acquisitions and at constant exchange rates,
was 41.8%. The cost:income ratio is calculated
excluding purchased intangibles amortisation,
integration costs and net gain on sale of
strategic investments and subsidiaries, and
after netting operating lease depreciation
against rental income.
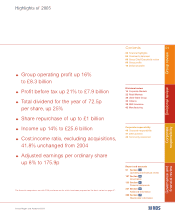
Group operating profit up 16%
Profit before tax up 21%
Adjusted earnings per ordinary share up 8% to 175.9p
Total dividend for the year up 25% to 72.5p per share
02
The annual accounts have, for the first time, been prepared in accordance with International Financial Reporting Standards. Certain standards relating to financial
instruments were not adopted until 1 January 2005. As explained on page 58, the Group has provided comparative information on a pro forma basis that includes
the estimated effect of these standards for the year ended 31 December 2004.