RBS 2005 Annual Report Download - page 94
Download and view the complete annual report
Please find page 94 of the 2005 RBS annual report below. You can navigate through the pages in the report by either clicking on the pages listed below, or by using the keyword search tool below to find specific information within the annual report.-
 1
1 -
2
-
3
-
4
-
5
-
6
-
7
-
8
-
9
-
10
-
11
-
12
-
13
-
14
-
15
-
16
-
17
-
18
-
19
-
20
-
21
-
22
-
23
-
24
-
25
-
26
-
27
-
28
-
29
-
30
-
31
-
32
-
33
-
34
-
35
-
36
-
37
-
38
-
39
-
40
-
41
-
42
-
43
-
44
-
45
-
46
-
47
-
48
-
49
-
50
-
51
-
52
-
53
-
54
-
55
-
56
-
57
-
58
-
59
-
60
-
61
-
62
-
63
-
64
-
65
-
66
-
67
-
68
-
69
-
70
-
71
-
72
-
73
-
74
-
75
-
76
-
77
-
78
-
79
-
80
-
81
-
82
-
83
-
 84
84 -
 85
85 -
 86
86 -
 87
87 -
 88
88 -
 89
89 -
 90
90 -
 91
91 -
 92
92 -
 93
93 -
 94
94 -
 95
95 -
 96
96 -
 97
97 -
 98
98 -
 99
99 -
 100
100 -
 101
101 -
 102
102 -
 103
103 -
 104
104 -
105
-
106
-
107
-
108
-
109
-
110
-
111
-
112
-
113
-
114
-
115
-
116
-
117
-
118
-
119
-
120
-
121
-
122
-
123
-
124
-
125
-
126
-
127
-
128
-
129
-
130
-
131
-
132
-
133
-
134
-
135
-
136
-
137
-
138
-
139
-
140
-
141
-
142
-
143
-
144
-
145
-
146
-
147
-
148
-
149
-
150
-
151
-
152
-
153
-
154
-
155
-
156
-
157
-
158
-
159
-
160
-
161
-
162
-
163
-
164
-
165
-
166
-
167
-
168
-
169
-
170
-
171
-
172
-
173
-
174
-
175
-
176
-
177
-
178
-
179
-
180
-
181
-
182
-
183
-
184
-
185
-
186
-
187
-
188
-
189
-
190
-
191
-
192
-
193
-
194
-
195
-
196
-
197
-
198
-
199
-
200
-
201
-
202
-
203
-
204
-
205
-
206
-
207
-
208
-
209
-
210
-
211
-
212
-
213
-
214
-
215
-
216
-
217
-
218
-
219
-
220
-
221
-
222
-
223
-
224
-
225
-
226
-
227
-
228
-
229
-
230
-
231
-
232
-
233
-
234
-
235
-
236
-
237
-
238
-
239
-
240
-
241
-
242
-
243
-
244
-
245
-
246
-
247
-
248
-
249
-
250
-
251
-
252
-
253
-
254
-
255
-
256
-
257
-
258
-
259
-
260
-
261
-
262
-
263
-
264
-
265
-
266
-
267
-
268
-
269
-
270
-
271
-
272
 |
 |

92
Operating and financial review
Operating and financial review continued
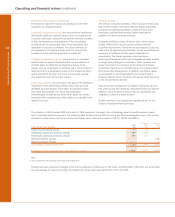
Distribution of credit risk assets by geography
The Group is currently active in 27 countries, with its principal focus on the UK, North America and Europe.
During 2005 there was further geographic diversification of
credit risk assets away from the UK and into the rest of Europe
and North America. As at 31 December 2005, 49.3% of credit
risk assets were within the UK. North America and Europe
account for 45.5% of credit risk assets with the remaining 5.2%
in the rest of the world.
Distribution of credit risk assets by product and customer type
The Group also monitors the breakdown of the credit portfolio by customer type and product type. The Group’s largest exposure
by credit risk assets is corporate customer lending products which represent 31% of credit risk assets as at 31 December 2005
(2004 – 30%). As illustrated in the industry analysis this exposure is well diversified across industry sectors.
0%
20%
40%
60%
80%
100%
Rest of world Europe United Kingdom
North America
2004 2005
52.2 49.3
25.9 27.3
16.7 18.2
5.1 5.2
2004
2005
0% 5% 10% 15% 20% 25% 30% 35%
Lending to corporate customers
Lending to individuals (mortgages)
Debt securities to banks, sovereigns
and quasi-government
Lending to individuals (other)
Debt securities to corporate customers
Lending to small businesses
Lending to banks, sovereigns
and quasi government
Asset-backed securities
Other and off-balance sheet