RBS 2005 Annual Report Download - page 82
Download and view the complete annual report
Please find page 82 of the 2005 RBS annual report below. You can navigate through the pages in the report by either clicking on the pages listed below, or by using the keyword search tool below to find specific information within the annual report.-
 1
1 -
2
-
3
-
4
-
5
-
6
-
7
-
8
-
9
-
10
-
11
-
12
-
13
-
14
-
15
-
16
-
17
-
18
-
19
-
20
-
21
-
22
-
23
-
24
-
25
-
26
-
27
-
28
-
29
-
30
-
31
-
32
-
33
-
34
-
35
-
36
-
37
-
38
-
39
-
40
-
41
-
42
-
43
-
44
-
45
-
46
-
47
-
48
-
49
-
50
-
51
-
52
-
53
-
54
-
55
-
56
-
57
-
58
-
59
-
60
-
61
-
62
-
63
-
64
-
65
-
66
-
67
-
68
-
69
-
70
-
71
-
 72
72 -
 73
73 -
 74
74 -
 75
75 -
 76
76 -
 77
77 -
 78
78 -
 79
79 -
 80
80 -
 81
81 -
 82
82 -
 83
83 -
 84
84 -
 85
85 -
 86
86 -
 87
87 -
 88
88 -
 89
89 -
 90
90 -
 91
91 -
 92
92 -
93
-
94
-
95
-
96
-
97
-
98
-
99
-
100
-
101
-
102
-
103
-
104
-
105
-
106
-
107
-
108
-
109
-
110
-
111
-
112
-
113
-
114
-
115
-
116
-
117
-
118
-
119
-
120
-
121
-
122
-
123
-
124
-
125
-
126
-
127
-
128
-
129
-
130
-
131
-
132
-
133
-
134
-
135
-
136
-
137
-
138
-
139
-
140
-
141
-
142
-
143
-
144
-
145
-
146
-
147
-
148
-
149
-
150
-
151
-
152
-
153
-
154
-
155
-
156
-
157
-
158
-
159
-
160
-
161
-
162
-
163
-
164
-
165
-
166
-
167
-
168
-
169
-
170
-
171
-
172
-
173
-
174
-
175
-
176
-
177
-
178
-
179
-
180
-
181
-
182
-
183
-
184
-
185
-
186
-
187
-
188
-
189
-
190
-
191
-
192
-
193
-
194
-
195
-
196
-
197
-
198
-
199
-
200
-
201
-
202
-
203
-
204
-
205
-
206
-
207
-
208
-
209
-
210
-
211
-
212
-
213
-
214
-
215
-
216
-
217
-
218
-
219
-
220
-
221
-
222
-
223
-
224
-
225
-
226
-
227
-
228
-
229
-
230
-
231
-
232
-
233
-
234
-
235
-
236
-
237
-
238
-
239
-
240
-
241
-
242
-
243
-
244
-
245
-
246
-
247
-
248
-
249
-
250
-
251
-
252
-
253
-
254
-
255
-
256
-
257
-
258
-
259
-
260
-
261
-
262
-
263
-
264
-
265
-
266
-
267
-
268
-
269
-
270
-
271
-
272
 |
 |

80
Operating and financial review
Operating and financial review continued
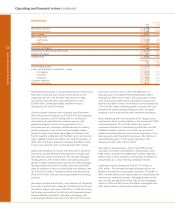
Manufacturing
Pro forma
2005 2004
£m £m
Staff costs 740 753
Other costs 2,003 1,799
Total manufacturing costs 2,743 2,552
Analysis:
Group Technology 945 852
Group Purchasing and Property Operations 1,013 927
Customer Support and other operations 785 773
Total manufacturing costs 2,743 2,552
Manufacturing’s costs increased by 7% to £2,743 million.
Excluding software amortisation, costs rose by 4%. Costs
relating to internal software development, which under UK
GAAP were written off as incurred, are now under IFRS
capitalised and amortised.
Group Technology costs increased by 11% to £945 million.
Excluding software amortisation, costs were up 2%, with
support for increased business volumes offset by efficiency
improvements. The Group Efficiency Programme was
substantially completed during the year, with major
implementations such as a new system for handling customer
queries and a new customer account-opening platform. The
Churchill systems integration was completed in September 2005.
Group Purchasing and Property Operations costs increased by
9% to £1,013 million. We improved the efficiency of our
property utilisation in 2005 while continuing our programme of
investment both in the branch networks and in our major
operational centres, including Birmingham, Manchester and
our new headquarters in Edinburgh.
Customer Support and other operations costs rose by just 2%,
despite a much greater increase in the business volumes
supported. Cash withdrawals from ATMs, for example, rose by
13%, while we handled 10% more mortgage applications and
7% more personal loan volumes. These increases were
absorbed by improved efficiency through the delivery of new
systems and ways of working.